IHOP 2013 Annual Report Download - page 99
Download and view the complete annual report
Please find page 99 of the 2013 IHOP annual report below. You can navigate through the pages in the report by either clicking on the pages listed below, or by using the keyword search tool below to find specific information within the annual report.-
 1
1 -
2
-
3
-
4
-
5
-
6
-
7
-
8
-
9
-
10
-
11
-
12
-
13
-
14
-
15
-
16
-
17
-
18
-
19
-
20
-
21
-
22
-
23
-
24
-
25
-
26
-
27
-
28
-
29
-
30
-
31
-
32
-
33
-
34
-
35
-
36
-
37
-
38
-
39
-
40
-
41
-
42
-
43
-
44
-
45
-
46
-
47
-
48
-
49
-
50
-
51
-
52
-
53
-
54
-
55
-
56
-
57
-
58
-
59
-
60
-
61
-
62
-
63
-
64
-
65
-
66
-
67
-
68
-
69
-
70
-
71
-
72
-
73
-
74
-
75
-
76
-
77
-
78
-
79
-
80
-
81
-
82
-
83
-
84
-
85
-
86
-
87
-
88
-
 89
89 -
 90
90 -
 91
91 -
 92
92 -
 93
93 -
 94
94 -
 95
95 -
 96
96 -
 97
97 -
 98
98 -
 99
99 -
 100
100 -
 101
101 -
 102
102 -
 103
103 -
 104
104 -
 105
105 -
 106
106 -
 107
107 -
 108
108 -
 109
109 -
110
-
111
-
112
-
113
-
114
-
115
-
116
-
117
-
118
-
119
-
120
-
121
-
122
-
123
-
124
-
125
-
126
-
127
-
128
-
129
-
130
-
131
-
132
-
133
-
134
-
135
-
136
-
137
-
138
-
139
-
140
-
141
-
142
-
143
 |
 |

DineEquity, Inc. and Subsidiaries
Notes to the Consolidated Financial Statements (Continued)
78
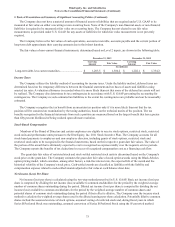
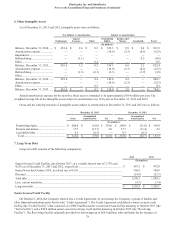
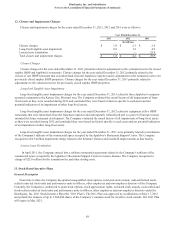
6. Other Intangible Assets
As of December 31, 2013 and 2012, intangible assets were as follows:
Not Subject to Amortization Subject to Amortization
Tradename
Liquor
Licenses Other
Franchising
Rights
Recipes and
Menus Leaseholds Total
(In millions)
Balance, December 31, 2010 ...... $ 652.4 $ 2.6 $ 0.3 $ 169.3 $ 8.9 $ 2.4 $ 835.9
Amortization expense ................. — — — (10.0) (2.3) (0.6) (12.9)
Impairment.................................. ———————
Refranchising.............................. — (1.1) — — 0.3 (0.8)
Other ........................................... — — 0.2 — — 0.2
Balance, December 31, 2011 ...... 652.4 1.5 0.5 159.3 6.6 2.1 822.4
Amortization expense ................. — — — (10.0) (2.3) (0.2) (12.5)
Refranchising.............................. — (1.5) (0.1) (0.3) — (1.9) (3.8)
Other ........................................... — — ————
Balance, December 31, 2012 ...... 652.4 — 0.4 149.0 4.3 — 806.1
Amortization expense ................. — — — (10.0) (2.3) — (12.3)
Other ........................................... — — 0.3———0.3
Balance, December 31, 2013 ...... $ 652.4 $ — $ 0.7 $ 139.0 $ 2.0 $ — $ 794.1
Annual amortization expense for the next five fiscal years is estimated to be approximately $10.4 million per year. The
weighted average life of the intangible assets subject to amortization was 19.0 years at December 31, 2013 and 2012.
Gross and net carrying amounts of intangible assets subject to amortization at December 31, 2013 and 2012 are as follows:
December 31, 2013 December 31, 2012
Gross
Accumulated
Amortization Net Gross
Accumulated
Amortization Net
(In millions)
Franchising rights........................................ $ 200.0 $ (61.0) $ 139.0 $ 200.0 $ (51.0) $ 149.0
Recipes and menus...................................... 15.7 (13.7) 2.0 15.7 (11.4) 4.3
Leaseholds/other ......................................... 0.3 (0.3) — 0.3 (0.3) —
Total.......................................................... $ 216.0 $ (75.0) $ 141.0 $ 216.0 $ (62.7) $ 153.3
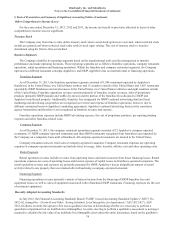
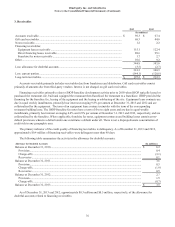
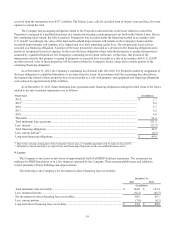
7. Long-Term Debt
Long-term debt consists of the following components:
2013 2012
(In millions)
Senior Secured Credit Facility, due October 2017, at a variable interest rate of 3.75% and
4.25% as of December 31, 2013 and 2012, respectively............................................................ $ 467.2 $ 472.0
Senior Notes due October 2018, at a fixed rate of 9.5% ............................................................ 760.8 760.8
Discount...................................................................................................................................... (19.8)(23.3)
Total debt .................................................................................................................................... 1,208.2 1,209.5
Less: current maturities............................................................................................................... (4.7)(7.4)
Long-term debt ........................................................................................................................... $ 1,203.5 $ 1,202.1
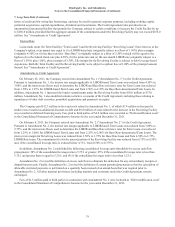
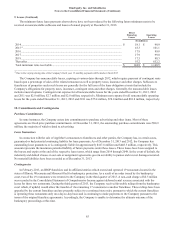
Senior Secured Credit Facility
On October 8, 2010, the Company entered into a Credit Agreement, by and among the Company, a group of lenders and
other financial institutions party thereto (the “Credit Agreement”). The Credit Agreement established a senior secured credit
facility (the “Credit Facility”) that consisted of a $900.0 million senior secured term loan facility maturing in October 2017 (the
“Term Facility”) and a $50.0 million senior secured revolving credit facility maturing in October 2015 (the “Revolving
Facility”). The Revolving Facility originally provided for borrowings up to $50.0 million, with sub-limits for the issuance of