IHOP 2013 Annual Report Download - page 48
Download and view the complete annual report
Please find page 48 of the 2013 IHOP annual report below. You can navigate through the pages in the report by either clicking on the pages listed below, or by using the keyword search tool below to find specific information within the annual report.-
 1
1 -
2
-
3
-
4
-
5
-
6
-
7
-
8
-
9
-
10
-
11
-
12
-
13
-
14
-
15
-
16
-
17
-
18
-
19
-
20
-
21
-
22
-
23
-
24
-
25
-
26
-
27
-
28
-
29
-
30
-
31
-
32
-
33
-
34
-
35
-
36
-
37
-
 38
38 -
 39
39 -
 40
40 -
 41
41 -
 42
42 -
 43
43 -
 44
44 -
 45
45 -
 46
46 -
 47
47 -
 48
48 -
 49
49 -
 50
50 -
 51
51 -
 52
52 -
 53
53 -
 54
54 -
 55
55 -
 56
56 -
 57
57 -
 58
58 -
59
-
60
-
61
-
62
-
63
-
64
-
65
-
66
-
67
-
68
-
69
-
70
-
71
-
72
-
73
-
74
-
75
-
76
-
77
-
78
-
79
-
80
-
81
-
82
-
83
-
84
-
85
-
86
-
87
-
88
-
89
-
90
-
91
-
92
-
93
-
94
-
95
-
96
-
97
-
98
-
99
-
100
-
101
-
102
-
103
-
104
-
105
-
106
-
107
-
108
-
109
-
110
-
111
-
112
-
113
-
114
-
115
-
116
-
117
-
118
-
119
-
120
-
121
-
122
-
123
-
124
-
125
-
126
-
127
-
128
-
129
-
130
-
131
-
132
-
133
-
134
-
135
-
136
-
137
-
138
-
139
-
140
-
141
-
142
-
143
 |
 |

27
Item 6. Selected Financial Data.
The following selected consolidated financial data should be read in conjunction with the consolidated financial statements
and notes thereto and “Management's Discussion and Analysis of Financial Condition and Results of Operations” appearing
elsewhere in this Annual Report on Form 10-K. The consolidated statement of operations information and the consolidated
balance sheet data for the years ended and as of December 31, 2013, 2012, 2011, 2010 and 2009 are derived from our audited
consolidated financial statements.
Fiscal Year Ended December 31,
2013 2012 2011 2010 2009
(In millions, except per share amounts and restaurant data)
Segment Revenues
Franchise and restaurant revenues (a) .................................................................. $ 502.6 $ 712.5 $ 929.5 $ 1,192.7 $ 1,263.0
Rental income....................................................................................................... 124.8 122.9 126.0 124.5 133.9
Financing revenues............................................................................................... 13.1 14.5 19.7 16.4 17.9
Total revenues................................................................................................. 640.5 849.9 1,075.2 1,333.6 1,414.8
Segment Expenses
Franchise and restaurant expenses (a) .................................................................. 173.3 359.2 563.4 802.8 868.7
Rental expenses .................................................................................................... 97.3 97.2 98.2 99.0 100.2
Financing expenses............................................................................................... 0.2 1.6 6.0 2.0 0.4
Total segment expenses.................................................................................. 270.8 458.0 667.6 903.8 969.3
Gross segment profit ............................................................................................ 369.7 391.9 407.6 429.8 445.5
General and administrative expenses ................................................................... 143.6 163.2 155.8 160.3 157.7
Interest expense .................................................................................................... 100.3 114.3 132.7 171.5 186.3
Closure and impairment charges .......................................................................... 1.8 4.2 29.9 4.3 105.6
Loss (gain) on extinguishment of debt and temporary equity.............................. 0.1 5.6 11.2 107.0 (45.7)
Gain on disposition of assets (a)........................................................................... (0.2) (102.6) (43.3) (13.5) (7.3)
Other expense (b) ................................................................................................. 13.6 12.3 16.3 12.3 12.3
Income (loss) before income taxes............................................................................. 110.6 194.9 105.0 (12.1) 36.6
Income tax (provision) benefit ................................................................................... (38.6) (67.2) (29.8) 9.3 (5.2)
Net income (loss)....................................................................................................... 72.0 127.7 75.2 (2.8) 31.4
Less: Series A preferred stock dividends.................................................................... — — — (25.9) (19.5)
Less: Accretion of Series B preferred stock............................................................... — (2.5) (2.6) (2.5) (2.3)
Less: Net (income) loss allocated to unvested participating restricted stock............. (1.2) (2.7) (1.9) 1.2 (0.4)
Net income (loss) available to common stockholders ............................................ $ 70.8 $ 122.5 $ 70.7 $ (30.0) $ 9.2
Net income (loss) available to common stockholders per share:
Basic ..................................................................................................................... $ 3.75 $ 6.81 $ 3.96 $ (1.74) $ 0.55
Diluted .................................................................................................................. $ 3.70 $ 6.63 $ 3.89 $ (1.74) $ 0.55
Weighted average shares outstanding:
Basic ..................................................................................................................... 18.9 18.0 17.8 17.2 16.9
Diluted .................................................................................................................. 19.1 18.9 18.2 17.2 16.9
Dividends declared and paid per common share................................................... $ 3.00 $ — $ — $ — $ —
Balance Sheet Data (end of year):
Cash and cash equivalents.................................................................................... $ 106.0 $ 64.5 $ 60.7 $ 102.3 $ 82.3
Restricted cash—short-term and long-term (c) .................................................... 0.7 1.9 1.2 1.6 120.9
Property and equipment, net (a) ........................................................................... 274.3 294.4 474.2 612.2 771.4
Total assets............................................................................................................ 2,404.6 2,415.4 2,614.3 2,856.6 3,100.9
Long-term debt, less current maturities................................................................ 1,203.5 1,202.1 1,411.4 1,631.5 1,637.2
Capital lease obligations, less current maturities ................................................. 111.7 124.4 134.4 144.0 152.8
Financing obligations, less current maturities...................................................... 48.8 52.0 162.7 237.8 309.4
Stockholders' equity ............................................................................................. 315.2 308.8 155.2 83.6 69.9
Other Financial Data:
Cash flows provided by operating activities ........................................................ $ 127.8 $ 52.9 $ 121.7 $ 179.3 $ 157.8
Capital expenditures ............................................................................................. 7.0 17.0 26.3 18.7 15.4
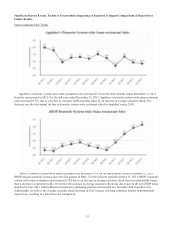
Domestic system-wide same-restaurant sales percentage change:
Applebee's ............................................................................................................ (0.3)% 1.2 % 2.0 % 0.3% (4.5)%
IHOP..................................................................................................................... 2.4 % (1.6)% (2.0)% 0.0% (0.8)%
Total restaurants (end of year):
Applebee's ............................................................................................................ 2,011 2,034 2,019 2,010 2,008
IHOP..................................................................................................................... 1,620 1,581 1,550 1,504 1,456
Total 3,631 3,615 3,569 3,514 3,464
_________________________________________________________________________
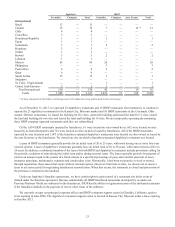
(a) We refranchised 376 Applebee's company-operated restaurants between 2009 and 2012.
(b) Includes $12.3 in amortization of intangible assets in each year as well as $1.3 and $4.0 of debt modification costs in 2013 and 2011, respectively.
(c) Cash restrictions related to securitized debt were eliminated by a refinancing of long-term debt in 2010.