IHOP 2013 Annual Report Download - page 56
Download and view the complete annual report
Please find page 56 of the 2013 IHOP annual report below. You can navigate through the pages in the report by either clicking on the pages listed below, or by using the keyword search tool below to find specific information within the annual report.-
 1
1 -
2
-
3
-
4
-
5
-
6
-
7
-
8
-
9
-
10
-
11
-
12
-
13
-
14
-
15
-
16
-
17
-
18
-
19
-
20
-
21
-
22
-
23
-
24
-
25
-
26
-
27
-
28
-
29
-
30
-
31
-
32
-
33
-
34
-
35
-
36
-
37
-
38
-
39
-
40
-
41
-
42
-
43
-
44
-
45
-
 46
46 -
 47
47 -
 48
48 -
 49
49 -
 50
50 -
 51
51 -
 52
52 -
 53
53 -
 54
54 -
 55
55 -
 56
56 -
 57
57 -
 58
58 -
 59
59 -
 60
60 -
 61
61 -
 62
62 -
 63
63 -
 64
64 -
 65
65 -
 66
66 -
67
-
68
-
69
-
70
-
71
-
72
-
73
-
74
-
75
-
76
-
77
-
78
-
79
-
80
-
81
-
82
-
83
-
84
-
85
-
86
-
87
-
88
-
89
-
90
-
91
-
92
-
93
-
94
-
95
-
96
-
97
-
98
-
99
-
100
-
101
-
102
-
103
-
104
-
105
-
106
-
107
-
108
-
109
-
110
-
111
-
112
-
113
-
114
-
115
-
116
-
117
-
118
-
119
-
120
-
121
-
122
-
123
-
124
-
125
-
126
-
127
-
128
-
129
-
130
-
131
-
132
-
133
-
134
-
135
-
136
-
137
-
138
-
139
-
140
-
141
-
142
-
143
 |
 |

35
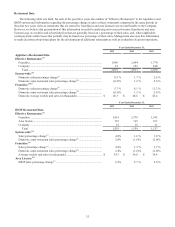
Restaurant Data
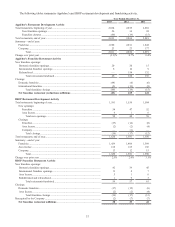
The following table sets forth, for each of the past three years, the number of “Effective Restaurants” in the Applebee’s and
IHOP systems and information regarding the percentage change in sales at those restaurants compared to the same periods in
the prior two years. Sales at restaurants that are owned by franchisees and area licensees are not attributable to the Company.
However, we believe that presentation of this information is useful in analyzing our revenues because franchisees and area
licensees pay us royalties and advertising fees that are generally based on a percentage of their sales, and, where applicable,
rental payments under leases that partially may be based on a percentage of their sales. Management also uses this information
to make decisions about future plans for the development of additional restaurants as well as evaluation of current operations.
Year Ended December 31,
2013 2012 2011
Applebee's Restaurant Data
Effective Restaurants:(a)
Franchise .................................................................................................... 1,996 1,894 1,770
Company .................................................................................................... 23 123 240
Total....................................................................................................... 2,019 2,017 2,010
System-wide:(b)
Domestic sales percentage change(c) .......................................................... 0.3 % 1.7 % 2.6 %
Domestic same-restaurant sales percentage change(d)................................ (0.3)% 1.2 % 2.0 %
Franchise:(b)(e)
Domestic sales percentage change(c) .......................................................... 5.7 % 8.1 % 11.3 %
Domestic same-restaurant sales percentage change(d)................................ (0.3)% 1.3 % 2.0 %
Domestic average weekly unit sales (in thousands)................................... $ 46.5 $ 46.6 $ 46.4
Year Ended December 31,
2013 2012 2011
IHOP Restaurant Data
Effective Restaurants:(a)
Franchise .................................................................................................... 1,414 1,379 1,343
Area license ................................................................................................ 167 165 163
Company .................................................................................................... 12 15 11
Total 1,593 1,559 1,517
System-wide:(b)
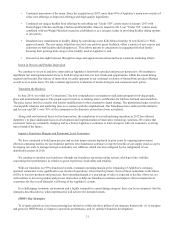
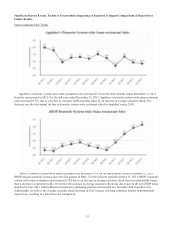
Sales percentage change(c) .......................................................................... 4.8% 1.6 % 1.9 %
Domestic same-restaurant sales percentage change(d)................................ 2.4% (1.6)% (2.0)%
Franchise:(b)
Sales percentage change(c) .......................................................................... 4.8% 1.3 % 1.7 %
Domestic same-restaurant sales percentage change(d)................................ 2.4% (1.6)% (2.0)%
Average weekly unit sales (in thousands) .................................................. $ 34.7 $ 34.0 $ 34.4
Area License:(b)
IHOP sales percentage change(c) ................................................................ 6.3% 2.7 % 2.9 %