IHOP 2013 Annual Report Download - page 76
Download and view the complete annual report
Please find page 76 of the 2013 IHOP annual report below. You can navigate through the pages in the report by either clicking on the pages listed below, or by using the keyword search tool below to find specific information within the annual report.-
 1
1 -
2
-
3
-
4
-
5
-
6
-
7
-
8
-
9
-
10
-
11
-
12
-
13
-
14
-
15
-
16
-
17
-
18
-
19
-
20
-
21
-
22
-
23
-
24
-
25
-
26
-
27
-
28
-
29
-
30
-
31
-
32
-
33
-
34
-
35
-
36
-
37
-
38
-
39
-
40
-
41
-
42
-
43
-
44
-
45
-
46
-
47
-
48
-
49
-
50
-
51
-
52
-
53
-
54
-
55
-
56
-
57
-
58
-
59
-
60
-
61
-
62
-
63
-
64
-
65
-
 66
66 -
 67
67 -
 68
68 -
 69
69 -
 70
70 -
 71
71 -
 72
72 -
 73
73 -
 74
74 -
 75
75 -
 76
76 -
 77
77 -
 78
78 -
 79
79 -
 80
80 -
 81
81 -
 82
82 -
 83
83 -
 84
84 -
 85
85 -
 86
86 -
87
-
88
-
89
-
90
-
91
-
92
-
93
-
94
-
95
-
96
-
97
-
98
-
99
-
100
-
101
-
102
-
103
-
104
-
105
-
106
-
107
-
108
-
109
-
110
-
111
-
112
-
113
-
114
-
115
-
116
-
117
-
118
-
119
-
120
-
121
-
122
-
123
-
124
-
125
-
126
-
127
-
128
-
129
-
130
-
131
-
132
-
133
-
134
-
135
-
136
-
137
-
138
-
139
-
140
-
141
-
142
-
143
 |
 |

55
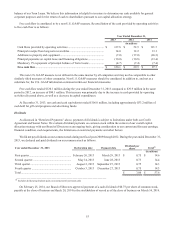
balance of our Term Loans. We believe this information is helpful to investors to determine our cash available for general
corporate purposes and for the return of cash to shareholders pursuant to our capital allocation strategy.
Free cash flow is considered to be a non-U.S. GAAP measure. Reconciliation of the cash provided by operating activities
to free cash flow is as follows:
Year Ended December 31,
2013 2012 2011
(In millions)
Cash flows provided by operating activities................................................... $ 127.8 $ 52.9 $ 121.7
Principal receipts from long-term receivables................................................ 14.0 12.2 13.1
Additions to property and equipment ............................................................. (7.0)(17.0)(26.3)
Principal payments on capital lease and financing obligations ...................... (10.0)(10.8)(13.4)
Mandatory 1% repayment of principal balance of Term Loans ..................... (4.7)(7.4)(7.4)
Free cash flow................................................................................................ $ 120.1 $ 29.9 $ 87.7
This non-U.S. GAAP measure is not defined in the same manner by all companies and may not be comparable to other
similarly titled measures of other companies. Non-U.S. GAAP measures should be considered in addition to, and not as a
substitute for, the U.S. GAAP information contained within our financial statements.
Free cash flow totaled $120.1 million during the year ended December 31, 2013 compared to $29.9 million in the same
period in 2012, an increase of $90.1 million. This increase was primarily due to the increase in cash provided by operating
activities discussed above, as well as a decrease in capital expenditures.
At December 31, 2013, our cash and cash equivalents totaled $106.0 million, including approximately $53.2 million of
cash held for gift card programs and advertising funds.
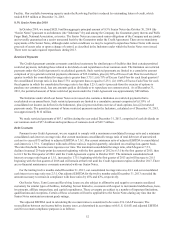
Dividends
As discussed in “Restricted Payments” above, payment of dividends is subject to limitations under both our Credit
Agreement and Senior Notes. We evaluate dividend payments on common stock within the context of our overall capital
allocation strategy with our Board of Directors on an ongoing basis, giving consideration to our current and forecast earnings,
financial condition, cash requirements, the limitations on restricted payments and other factors.
We did not pay dividends on our common stock during our fiscal years 2009 through 2012. During the year ended December 31,
2013, we declared and paid dividends on our common stock as follows:
Year ended December 31, 2013 Declaration date Payment date Dividend per
share Total(1)
(In millions)
First quarter........................................................... February 26, 2013 March 29, 2013 $ 0.75 $ 14.6
Second quarter ...................................................... May 14, 2013 June 28, 2013 0.75 14.4
Third quarter ......................................................... August 2, 2013 September 27, 2013 0.75 14.3
Fourth quarter ....................................................... October 3, 2013 December 27, 2013 0.75 14.3
Total...................................................................... $ 3.00 $ 57.6
_______________________________________________________________
(1) Includes dividend equivalents paid on unvested restricted stock units
On February 25, 2014, our Board of Directors approved payment of a cash dividend of $0.75 per share of common stock,
payable at the close of business on March 28, 2014 to the stockholders of record as of the close of business on March 14, 2014.