IHOP 2013 Annual Report Download - page 66
Download and view the complete annual report
Please find page 66 of the 2013 IHOP annual report below. You can navigate through the pages in the report by either clicking on the pages listed below, or by using the keyword search tool below to find specific information within the annual report.-
 1
1 -
2
-
3
-
4
-
5
-
6
-
7
-
8
-
9
-
10
-
11
-
12
-
13
-
14
-
15
-
16
-
17
-
18
-
19
-
20
-
21
-
22
-
23
-
24
-
25
-
26
-
27
-
28
-
29
-
30
-
31
-
32
-
33
-
34
-
35
-
36
-
37
-
38
-
39
-
40
-
41
-
42
-
43
-
44
-
45
-
46
-
47
-
48
-
49
-
50
-
51
-
52
-
53
-
54
-
55
-
 56
56 -
 57
57 -
 58
58 -
 59
59 -
 60
60 -
 61
61 -
 62
62 -
 63
63 -
 64
64 -
 65
65 -
 66
66 -
 67
67 -
 68
68 -
 69
69 -
 70
70 -
 71
71 -
 72
72 -
 73
73 -
 74
74 -
 75
75 -
 76
76 -
77
-
78
-
79
-
80
-
81
-
82
-
83
-
84
-
85
-
86
-
87
-
88
-
89
-
90
-
91
-
92
-
93
-
94
-
95
-
96
-
97
-
98
-
99
-
100
-
101
-
102
-
103
-
104
-
105
-
106
-
107
-
108
-
109
-
110
-
111
-
112
-
113
-
114
-
115
-
116
-
117
-
118
-
119
-
120
-
121
-
122
-
123
-
124
-
125
-
126
-
127
-
128
-
129
-
130
-
131
-
132
-
133
-
134
-
135
-
136
-
137
-
138
-
139
-
140
-
141
-
142
-
143
 |
 |

45
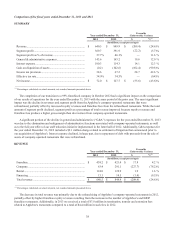
REVENUE
Year ended December 31, Favorable
(Unfavorable) Variance
2012 2011 $%(1)
(In millions, except percentages)
Franchise................................................................................ $ 421.4 $ 398.5 $ 22.9 5.8 %
Company................................................................................ 291.1 531.0 (239.9) (45.2)%
Rental..................................................................................... 122.9 126.0 (3.1) (2.5)%
Financing ............................................................................... 14.5 19.7 (5.2) (26.5)%
Total revenue ......................................................................... $ 849.9 $ 1,075.2 $ (225.3) (24.6)%
_____________________________________________________
(1) Percentages calculated on actual amounts, not rounded amounts presented above
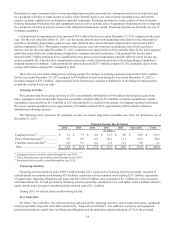
Revenues decreased to $849.9 million in 2012 from $1.1 billion in 2011. The decline was primarily due to the net effect of
refranchising 286 company-operated Applebee's restaurants in 2012 and 2011, and a 1.6% decrease in IHOP domestic system-
wide same-restaurant sales, partially offset by a 2.7% increase in IHOP effective franchise restaurants and a 1.2% increase in
Applebee's domestic system-wide same-restaurant sales.
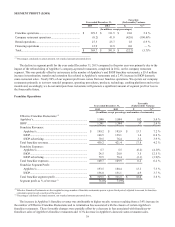
SEGMENT PROFIT (LOSS)
Year ended December 31,
Favorable
(Unfavorable) Variance
2012 2011 $%(1)
(In millions, except percentages)
Franchise operations......................................................... $ 311.5 $ 293.5 $ 18.0 6.1 %
Company restaurant operations........................................ 41.8 72.6 (30.8) (42.3)%
Rental operations.............................................................. 25.7 27.8 (2.1) (7.6)%
Financing operations ........................................................ 12.9 13.7 (0.8) (6.4)%
Total.................................................................................. $ 391.9 $ 407.6 $ (15.7) (3.9)%
_____________________________________________________
(1) Percentages calculated on actual amounts, not rounded amounts presented above
The decrease in segment profit was primarily due to the net effect of refranchising 286 Applebee's company-operated
restaurants in 2012 and 2011, the decrease in IHOP domestic system-wide same-restaurant sales and a write-off of deferred
lease rental income associated with franchised restaurants whose lease agreements were prematurely terminated. These
unfavorable factors were partially offset by the increase in IHOP effective franchise restaurants and the increase in Applebee's
same-restaurant sales.