IHOP 2013 Annual Report Download - page 116
Download and view the complete annual report
Please find page 116 of the 2013 IHOP annual report below. You can navigate through the pages in the report by either clicking on the pages listed below, or by using the keyword search tool below to find specific information within the annual report.-
 1
1 -
2
-
3
-
4
-
5
-
6
-
7
-
8
-
9
-
10
-
11
-
12
-
13
-
14
-
15
-
16
-
17
-
18
-
19
-
20
-
21
-
22
-
23
-
24
-
25
-
26
-
27
-
28
-
29
-
30
-
31
-
32
-
33
-
34
-
35
-
36
-
37
-
38
-
39
-
40
-
41
-
42
-
43
-
44
-
45
-
46
-
47
-
48
-
49
-
50
-
51
-
52
-
53
-
54
-
55
-
56
-
57
-
58
-
59
-
60
-
61
-
62
-
63
-
64
-
65
-
66
-
67
-
68
-
69
-
70
-
71
-
72
-
73
-
74
-
75
-
76
-
77
-
78
-
79
-
80
-
81
-
82
-
83
-
84
-
85
-
86
-
87
-
88
-
89
-
90
-
91
-
92
-
93
-
94
-
95
-
96
-
97
-
98
-
99
-
100
-
101
-
102
-
103
-
104
-
105
-
 106
106 -
 107
107 -
 108
108 -
 109
109 -
 110
110 -
 111
111 -
 112
112 -
 113
113 -
 114
114 -
 115
115 -
 116
116 -
 117
117 -
 118
118 -
 119
119 -
 120
120 -
 121
121 -
 122
122 -
 123
123 -
 124
124 -
 125
125 -
 126
126 -
127
-
128
-
129
-
130
-
131
-
132
-
133
-
134
-
135
-
136
-
137
-
138
-
139
-
140
-
141
-
142
-
143
 |
 |

DineEquity, Inc. and Subsidiaries
Notes to the Consolidated Financial Statements (Continued)
95
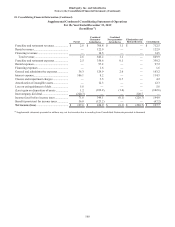
16. Net Income Per Share
The computation of the Company's basic and diluted net income (loss) per share is as follows:
Year Ended December 31,
2013 2012 2011
(In thousands, except per share data)
Numerator for basic and diluted income per common share:
Net income $ 72,037 $ 127,674 $ 75,192
Less: Series A preferred stock dividends — — —
Less: Accretion of Series B preferred stock — (2,498) (2,573)
Less: Net (income) loss allocated to unvested participating restricted
stock (1,200)(2,718)(1,886)
Net income available to common stockholders - basic 70,837 122,458 70,733
Effect of unvested participating restricted stock 4 127 34
Effect of dilutive securities:
Convertible Series B preferred stock — 2,498 —
Numerator - net income available to common shareholders - diluted $ 70,841 $ 125,083 $ 70,767
Denominator:
Weighted average outstanding shares of common stock - basic 18,871 17,992 17,846
Effect of dilutive securities:
Stock options 270 264 339
Convertible Series B preferred stock — 621 —
Weighted average outstanding shares of common stock - diluted 19,141 18,877 18,185
Net income (loss) per common share:
Basic $ 3.75 $ 6.81 $ 3.96
Diluted $ 3.70 $ 6.63 $ 3.89
For the year ended December 31, 2011, diluted income per common share is computed using the basic weighted average
number of common shares outstanding during the period, as the 643,000 shares from common stock equivalents would have
been antidilutive.