IHOP 2013 Annual Report Download - page 54
Download and view the complete annual report
Please find page 54 of the 2013 IHOP annual report below. You can navigate through the pages in the report by either clicking on the pages listed below, or by using the keyword search tool below to find specific information within the annual report.-
 1
1 -
2
-
3
-
4
-
5
-
6
-
7
-
8
-
9
-
10
-
11
-
12
-
13
-
14
-
15
-
16
-
17
-
18
-
19
-
20
-
21
-
22
-
23
-
24
-
25
-
26
-
27
-
28
-
29
-
30
-
31
-
32
-
33
-
34
-
35
-
36
-
37
-
38
-
39
-
40
-
41
-
42
-
43
-
 44
44 -
 45
45 -
 46
46 -
 47
47 -
 48
48 -
 49
49 -
 50
50 -
 51
51 -
 52
52 -
 53
53 -
 54
54 -
 55
55 -
 56
56 -
 57
57 -
 58
58 -
 59
59 -
 60
60 -
 61
61 -
 62
62 -
 63
63 -
 64
64 -
65
-
66
-
67
-
68
-
69
-
70
-
71
-
72
-
73
-
74
-
75
-
76
-
77
-
78
-
79
-
80
-
81
-
82
-
83
-
84
-
85
-
86
-
87
-
88
-
89
-
90
-
91
-
92
-
93
-
94
-
95
-
96
-
97
-
98
-
99
-
100
-
101
-
102
-
103
-
104
-
105
-
106
-
107
-
108
-
109
-
110
-
111
-
112
-
113
-
114
-
115
-
116
-
117
-
118
-
119
-
120
-
121
-
122
-
123
-
124
-
125
-
126
-
127
-
128
-
129
-
130
-
131
-
132
-
133
-
134
-
135
-
136
-
137
-
138
-
139
-
140
-
141
-
142
-
143
 |
 |
33
Significant Known Events, Trends or Uncertainties Impacting or Expected to Impact Comparisons of Reported or
Future Results
Same-restaurant Sales Trends
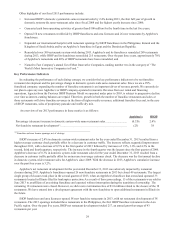
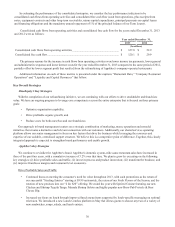
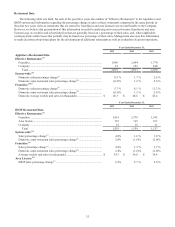
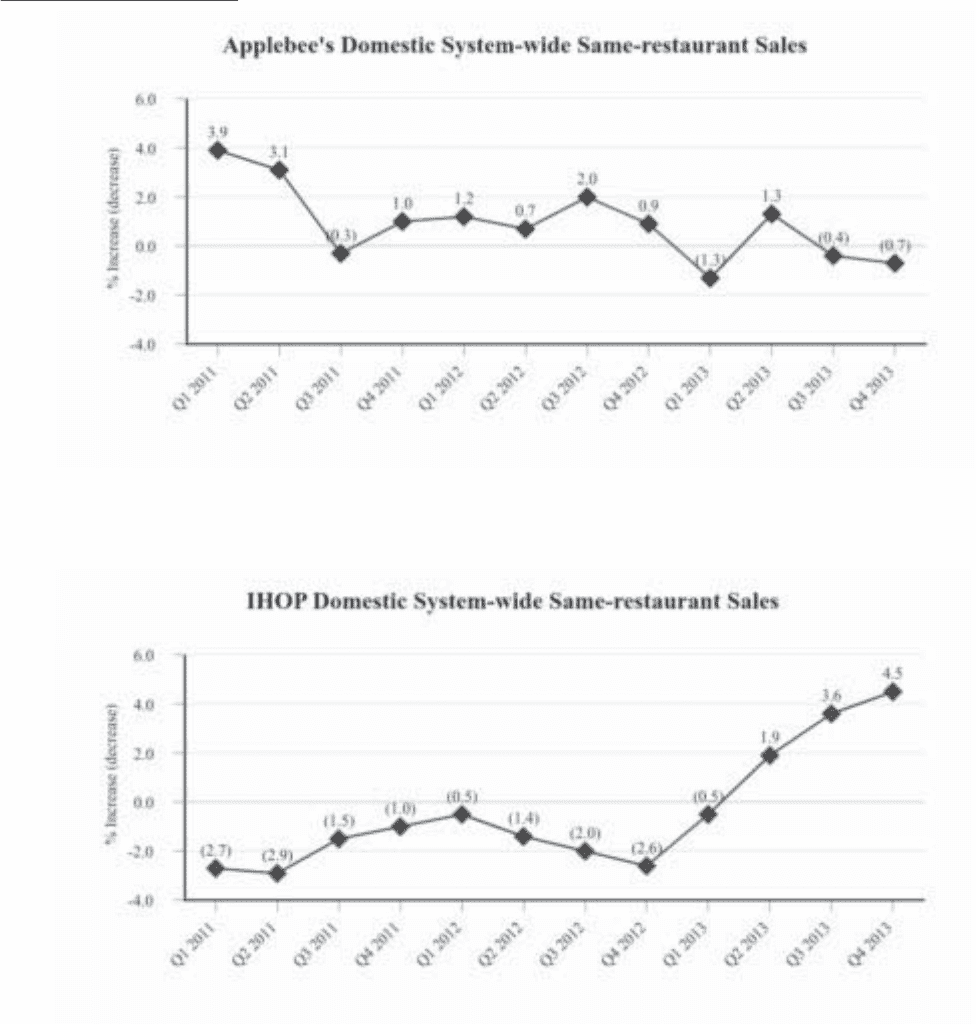
Applebee’s domestic system-wide same-restaurant sales decreased 0.7% for the three months ended December 31, 2013
from the same period in 2012. For the full year ended December 31, 2013, Applebee’s domestic system-wide same-restaurant
sales decreased 0.3%, due to a decline in customer traffic partially offset by an increase in average customer check. The
decrease was the first annual decline in domestic system-wide restaurant sales for Applebee's since 2009.
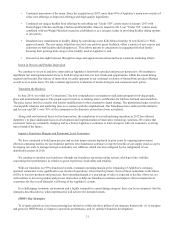
IHOP’s domestic system-wide same-restaurant sales increased 4.5% for the three months ended December 31, 2013,
IHOP's largest quarterly increase since the first quarter of 2006. For the full year ended December 31, 2013, IHOP's domestic
system-wide same-restaurant sales increased 2.4% due to an increase in average customer check that was substantially larger
than a decrease in customer traffic. We believe the increase in average customer check was due in part to the new IHOP menu
launched in June 2013 which influenced customers’ purchasing patterns and resulted in a favorable shift in product mix.
Additionally, we believe the average customer check declined in 2012 because of strong consumer interest in promotional
menu items, resulting in a lower base for comparison.