IHOP 2013 Annual Report Download - page 51
Download and view the complete annual report
Please find page 51 of the 2013 IHOP annual report below. You can navigate through the pages in the report by either clicking on the pages listed below, or by using the keyword search tool below to find specific information within the annual report.-
 1
1 -
2
-
3
-
4
-
5
-
6
-
7
-
8
-
9
-
10
-
11
-
12
-
13
-
14
-
15
-
16
-
17
-
18
-
19
-
20
-
21
-
22
-
23
-
24
-
25
-
26
-
27
-
28
-
29
-
30
-
31
-
32
-
33
-
34
-
35
-
36
-
37
-
38
-
39
-
40
-
 41
41 -
 42
42 -
 43
43 -
 44
44 -
 45
45 -
 46
46 -
 47
47 -
 48
48 -
 49
49 -
 50
50 -
 51
51 -
 52
52 -
 53
53 -
 54
54 -
 55
55 -
 56
56 -
 57
57 -
 58
58 -
 59
59 -
 60
60 -
 61
61 -
62
-
63
-
64
-
65
-
66
-
67
-
68
-
69
-
70
-
71
-
72
-
73
-
74
-
75
-
76
-
77
-
78
-
79
-
80
-
81
-
82
-
83
-
84
-
85
-
86
-
87
-
88
-
89
-
90
-
91
-
92
-
93
-
94
-
95
-
96
-
97
-
98
-
99
-
100
-
101
-
102
-
103
-
104
-
105
-
106
-
107
-
108
-
109
-
110
-
111
-
112
-
113
-
114
-
115
-
116
-
117
-
118
-
119
-
120
-
121
-
122
-
123
-
124
-
125
-
126
-
127
-
128
-
129
-
130
-
131
-
132
-
133
-
134
-
135
-
136
-
137
-
138
-
139
-
140
-
141
-
142
-
143
 |
 |

30
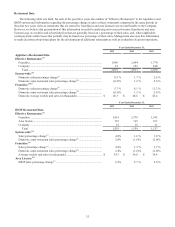
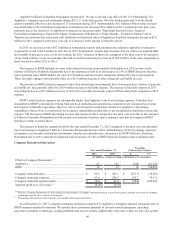
In evaluating the performance of the consolidated enterprise, we consider the key performance indicators to be
consolidated cash flows from operating activities and consolidated free cash flow (cash from operations, plus receipts from
notes, equipment contracts and other long-term receivables, minus capital expenditures, principal payments on capital leases
and financing obligations and the mandatory annual repayment of 1% of the principal balance of our Term Loans).
Consolidated cash flows from operating activities and consolidated free cash flow for the years ended December 31, 2013
and 2012 were as follows:
Year ended December 31,
2013 2012
(In millions)
Consolidated cash flows from operating activities ................................................................. $ 127.8 $ 52.9
Consolidated free cash flow.................................................................................................... $ 120.1 $ 29.9
The primary reasons for the increase in cash flows from operating activities were lower income tax payments, lower general
and administrative expenses and lower interest costs for the year ended December 31, 2013 compared to the same period of 2012,
partially offset by lower segment profit that resulted from the refranchising of Applebee's company-operated restaurants.
Additional information on each of these metrics is presented under the captions “Restaurant Data,” “Company Restaurant
Operations” and “Liquidity and Capital Resources” that follow.
Key Overall Strategies
DineEquity's Key Strategies
With the completion of our refranchising initiative, we are continuing with our efforts to drive stockholder and franchisee
value. We have an ongoing program to leverage core competencies across the entire enterprise that is focused on three primary
goals:
• Optimize organization capability;
• Drive profitable organic growth; and
• Reduce costs for both ourselves and our franchisees.
Our approach to brand management centers on a strategic combination of marketing, menu, operations and remodel
initiatives that creates a distinctive and relevant connection with our customers. Additionally, our shared services operating
platform allows our senior management to focus on key factors that drive the business while leveraging the resources and
expertise of our scalable, centralized support structure. We believe this is a competitive point of difference. Together, this closely
integrated approach is expected to strengthen brand performance and enable growth.
Applebee's Key Strategies
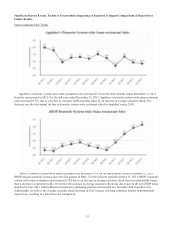
We continue to revitalize the Applebee's brand. Applebee's domestic system-wide same restaurant sales have increased in
three of the past four years, with a cumulative increase of 3.2% over that time. We plan to grow by executing on the following
key strategies: (i) drive profitable sales and traffic; (ii) invest in process and product innovation; (iii) transform the business; and
(iv) improve franchisee margins and restaurant level economics.
Drive Profitable Sales and Traffic
• Continued focus on meeting the consumer's need for value throughout 2013, with such promotions as the return of
our successful “Sizzling Entrées” starting at $9.99 nationwide, the return of our Fresh Flavors of the Season, and the
rotation of new products into our “2 for $20” offering. We ended the year with Spirited Cuisine featuring our new
Chicken and Shrimp Tequila Tango, Marsala Shrimp Sirloin and highly popular new Brew Pub Pretzels & Beer
Cheese Dip;
• Increased our focus on lunch through improved lunch menu items supported by lunch-specific messaging on national
television. We introduced a new Lunch Combos platform in May that allows guests to choose any two of a variety of
new sandwiches, soups, salads, and lunch entrées;