IHOP 2013 Annual Report Download - page 126
Download and view the complete annual report
Please find page 126 of the 2013 IHOP annual report below. You can navigate through the pages in the report by either clicking on the pages listed below, or by using the keyword search tool below to find specific information within the annual report.-
 1
1 -
2
-
3
-
4
-
5
-
6
-
7
-
8
-
9
-
10
-
11
-
12
-
13
-
14
-
15
-
16
-
17
-
18
-
19
-
20
-
21
-
22
-
23
-
24
-
25
-
26
-
27
-
28
-
29
-
30
-
31
-
32
-
33
-
34
-
35
-
36
-
37
-
38
-
39
-
40
-
41
-
42
-
43
-
44
-
45
-
46
-
47
-
48
-
49
-
50
-
51
-
52
-
53
-
54
-
55
-
56
-
57
-
58
-
59
-
60
-
61
-
62
-
63
-
64
-
65
-
66
-
67
-
68
-
69
-
70
-
71
-
72
-
73
-
74
-
75
-
76
-
77
-
78
-
79
-
80
-
81
-
82
-
83
-
84
-
85
-
86
-
87
-
88
-
89
-
90
-
91
-
92
-
93
-
94
-
95
-
96
-
97
-
98
-
99
-
100
-
101
-
102
-
103
-
104
-
105
-
106
-
107
-
108
-
109
-
110
-
111
-
112
-
113
-
114
-
115
-
 116
116 -
 117
117 -
 118
118 -
 119
119 -
 120
120 -
 121
121 -
 122
122 -
 123
123 -
 124
124 -
 125
125 -
 126
126 -
 127
127 -
 128
128 -
 129
129 -
 130
130 -
 131
131 -
 132
132 -
 133
133 -
 134
134 -
 135
135 -
 136
136 -
137
-
138
-
139
-
140
-
141
-
142
-
143
 |
 |

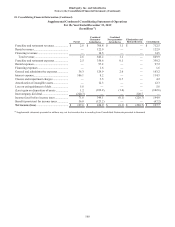
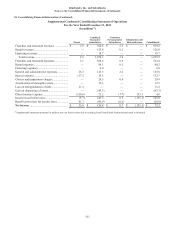
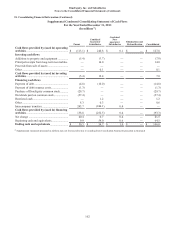
DineEquity, Inc. and Subsidiaries
Notes to the Consolidated Financial Statements (Continued)
105
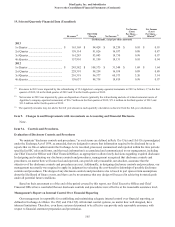
19. Selected Quarterly Financial Data (Unaudited)
Revenues(1) Operating
Margin Net Income (2)
Net Income
(Loss)
Per Share—
Basic(3)
Net Income
(Loss)
Per Share—
Diluted(3)
(In thousands, except per share amounts)
2013
1st Quarter ................................................ $ 163,169 $ 94,424 $ 18,239 $ 0.95 $ 0.93
2nd Quarter ............................................... 158,114 91,026 16,937 0.88 0.87
3rd Quarter................................................ 161,283 93,043 18,730 0.98 0.97
4th Quarter................................................ 157,901 91,199 18,131 0.95 0.94
2012
1st Quarter ................................................ $ 245,582 $ 108,575 $ 31,344 $ 1.69 $ 1.64
2nd Quarter ............................................... 229,391 98,254 16,938 0.89 0.88
3rd Quarter................................................ 216,318 96,377 60,573 3.26 3.14
4th Quarter................................................ 158,637 88,738 18,819 0.98 0.97
______________________________________________________________________________________________________
(1) Revenues in 2012 were impacted by the refranchising of 154 Applebee's company-operated restaurants in 2012 as follows: 17 in the first
quarter of 2012, 98 in the third quarter of 2012 and 39 in the fourth quarter of 2012.
(2) Net income in 2012 was impacted by gains on disposition of assets (primarily the refranchising and sale of related restaurant assets of
Applebee's company-operated restaurants) of $16.7 million in the first quarter of 2012, $73.6 million in the third quarter of 2012 and
$13.0 million in the fourth quarter of 2012.
(3) The quarterly amounts may not add to the full year amount as each quarterly calculation is discrete from the full-year calculation.
Item 9. Changes in and Disagreements with Accountants on Accounting and Financial Disclosure.
None.
Item 9A. Controls and Procedures.
Evaluation of Disclosure Controls and Procedures
We maintain "disclosure controls and procedures," as such terms are defined in Rule 13a-15(e) and 15d-15(e) promulgated
under the Exchange Act of 1934, as amended, that are designed to ensure that information required to be disclosed by us in
reports that we file or submit under the Exchange Act is recorded, processed, summarized and reported within the time periods
specified in SEC rules and forms, and that such information is accumulated and communicated to our management, including
our Chief Executive Officer and Chief Financial Officer, as appropriate to allow timely decisions regarding required disclosure.
In designing and evaluating our disclosure controls and procedures, management recognized that disclosure controls and
procedures, no matter how well conceived and operated, can provide only reasonable, not absolute, assurance that the
objectives of the disclosure controls and procedures are met. Additionally, in designing disclosure controls and procedures, our
management necessarily was required to apply its judgment in evaluating the cost-benefit relationship of possible disclosure
controls and procedures. The design of any disclosure controls and procedures also is based in part upon certain assumptions
about the likelihood of future events, and there can be no assurance that any design will succeed in achieving its stated goals
under all potential future conditions.
Based on their assessment as of the end of the period covered by this report, our Chief Executive Officer and Chief
Financial Officer have concluded that our disclosure controls and procedures were effective at the reasonable assurance level.
Management's Report on Internal Control Over Financial Reporting
Our management is responsible for establishing and maintaining adequate internal control over financial reporting, as
defined in Exchange Act Rules 13a-15(f) and 15d-15(f). All internal control systems, no matter how well designed, have
inherent limitations. Therefore, even those systems determined to be effective can provide only reasonable assurance with
respect to financial statement preparation and presentation.