IHOP 2013 Annual Report Download - page 87
Download and view the complete annual report
Please find page 87 of the 2013 IHOP annual report below. You can navigate through the pages in the report by either clicking on the pages listed below, or by using the keyword search tool below to find specific information within the annual report.-
 1
1 -
2
-
3
-
4
-
5
-
6
-
7
-
8
-
9
-
10
-
11
-
12
-
13
-
14
-
15
-
16
-
17
-
18
-
19
-
20
-
21
-
22
-
23
-
24
-
25
-
26
-
27
-
28
-
29
-
30
-
31
-
32
-
33
-
34
-
35
-
36
-
37
-
38
-
39
-
40
-
41
-
42
-
43
-
44
-
45
-
46
-
47
-
48
-
49
-
50
-
51
-
52
-
53
-
54
-
55
-
56
-
57
-
58
-
59
-
60
-
61
-
62
-
63
-
64
-
65
-
66
-
67
-
68
-
69
-
70
-
71
-
72
-
73
-
74
-
75
-
76
-
 77
77 -
 78
78 -
 79
79 -
 80
80 -
 81
81 -
 82
82 -
 83
83 -
 84
84 -
 85
85 -
 86
86 -
 87
87 -
 88
88 -
 89
89 -
 90
90 -
 91
91 -
 92
92 -
 93
93 -
 94
94 -
 95
95 -
 96
96 -
 97
97 -
98
-
99
-
100
-
101
-
102
-
103
-
104
-
105
-
106
-
107
-
108
-
109
-
110
-
111
-
112
-
113
-
114
-
115
-
116
-
117
-
118
-
119
-
120
-
121
-
122
-
123
-
124
-
125
-
126
-
127
-
128
-
129
-
130
-
131
-
132
-
133
-
134
-
135
-
136
-
137
-
138
-
139
-
140
-
141
-
142
-
143
 |
 |

66
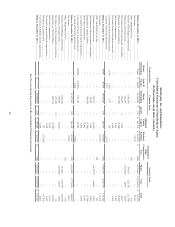
DineEquity, Inc. and Subsidiaries
Consolidated Statements of Stockholders' Equity
(In thousands, except share amounts)
Preferred Stock Common Stock Accumulated
Other
Comprehensive
Loss
Treasury Stock
Shares
Outstanding
Series B
Amount
Shares
Outstanding Amount
Additional
Paid-in
Capital
Retained
Earnings Shares Cost Total
Balance, December 31, 2010 ............................... 35,000 $ 42,055 18,183,083 $ 243 $ 192,214 $ 124,250 $ (282) 6,199,908 $ (274,901) $ 83,579
Net income ............................................................ — — — — — 75,192 — — — 75,192
Other comprehensive loss ..................................... — — — — — — (12) — — (12)
Purchase of DineEquity common stock ................ — — (534,101) — — — — 534,101 (21,170)(21,170)
Reissuance of treasury stock ................................. — — 135,230 — — — — (135,230) 4,298 4,298
Net issuance of shares pursuant to stock plans...... — — 366,055 4 2,423 — — — — 2,427
Repurchase of restricted shares ............................. — — (91,798) — (5,080) — — — — (5,080)
Stock-based compensation .................................... — — — — 9,492 — — — — 9,492
Tax benefit from stock options exercised.............. — — — — 6,494 — — — — 6,494
Conversion of Series B preferred stock................. (100) (120) 1,737 — 120 — — — — —
Accretion of Series B preferred stock ................... — 2,573 — — — (2,573) — — — —
Balance, December 31, 2011 ............................... 34,900 44,508 18,060,206 247 205,663 196,869 (294) 6,598,779 (291,773) 155,220
Net income ............................................................ — — — — — 127,674 — — — 127,674
Other comprehensive income................................ — — — — — — 142 — — 142
Reissuance of treasury stock ................................. — — 433,732 — (6,636) — — (433,732) 14,089 7,453
Net issuance of shares pursuant to stock plans...... — — 59,622 — 1,800 — — — — 1,800
Repurchase of restricted shares ............................. — — (34,829) — (1,740) — — — — (1,740)
Stock-based compensation .................................... — — — — 11,442 — — — — 11,442
Tax benefit from stock-based compensation......... — — — — 6,814 — — — — 6,814
Conversion of Series B preferred stock................. (34,900) (47,006) 679,168 7 46,999 — — — — —
Accretion of Series B preferred stock ................... — 2,498 — — — (2,498) — — — —
Balance, December 31, 2012 ............................... — — 19,197,899 254 264,342 322,045 (152) 6,165,047 (277,684) 308,805
Net income ............................................................ — — — — — 72,037 — — — 72,037
Other comprehensive loss ..................................... — — — — — — (12) — — (12)
Purchase of DineEquity common stock ................ — — (412,022) — — — — 412,022 (29,698)(29,698)
Reissuance of treasury stock ................................. — — 318,644 — (2,612) — — (318,644) 11,692 9,080
Net issuance of shares pursuant to stock plans...... — — (17,659) (1) — — — — — (1)
Repurchase of restricted shares ............................. — — (45,972) — (3,324) — — — — (3,324)
Stock-based compensation .................................... — — — — 9,364 — — — — 9,364
Tax benefit from stock-based compensation......... — — — — 3,690 — — — — 3,690
Dividends on common stock ................................. — — — — 139 (57,504) — — — (57,365)
Conversion of liability award to equity award ...... — — — — 2,603 — — — — 2,603
Balance, December 31, 2013 ............................... — $ — 19,040,890 $ 253 $ 274,202 $ 336,578 $ (164) 6,258,425 $ (295,690) $ 315,179
See the accompanying notes to the consolidated financial statements.