IHOP 2013 Annual Report Download - page 65
Download and view the complete annual report
Please find page 65 of the 2013 IHOP annual report below. You can navigate through the pages in the report by either clicking on the pages listed below, or by using the keyword search tool below to find specific information within the annual report.-
 1
1 -
2
-
3
-
4
-
5
-
6
-
7
-
8
-
9
-
10
-
11
-
12
-
13
-
14
-
15
-
16
-
17
-
18
-
19
-
20
-
21
-
22
-
23
-
24
-
25
-
26
-
27
-
28
-
29
-
30
-
31
-
32
-
33
-
34
-
35
-
36
-
37
-
38
-
39
-
40
-
41
-
42
-
43
-
44
-
45
-
46
-
47
-
48
-
49
-
50
-
51
-
52
-
53
-
54
-
 55
55 -
 56
56 -
 57
57 -
 58
58 -
 59
59 -
 60
60 -
 61
61 -
 62
62 -
 63
63 -
 64
64 -
 65
65 -
 66
66 -
 67
67 -
 68
68 -
 69
69 -
 70
70 -
 71
71 -
 72
72 -
 73
73 -
 74
74 -
 75
75 -
76
-
77
-
78
-
79
-
80
-
81
-
82
-
83
-
84
-
85
-
86
-
87
-
88
-
89
-
90
-
91
-
92
-
93
-
94
-
95
-
96
-
97
-
98
-
99
-
100
-
101
-
102
-
103
-
104
-
105
-
106
-
107
-
108
-
109
-
110
-
111
-
112
-
113
-
114
-
115
-
116
-
117
-
118
-
119
-
120
-
121
-
122
-
123
-
124
-
125
-
126
-
127
-
128
-
129
-
130
-
131
-
132
-
133
-
134
-
135
-
136
-
137
-
138
-
139
-
140
-
141
-
142
-
143
 |
 |

44
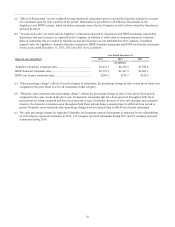
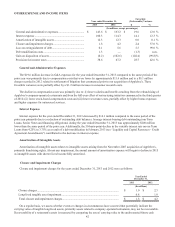
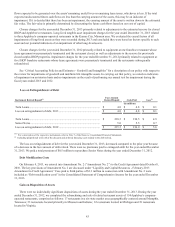
With the completion in October 2012 of our strategy to refranchise the substantial majority of Applebee's company-
operated restaurants, we do not expect significant gains or losses on dispositions of assets for the foreseeable future.
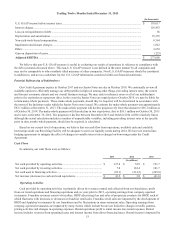
Income Tax Provision
We recorded a tax provision of $38.6 million in 2013 as compared to a tax provision of $67.2 million in 2012. The change
was primarily due to the decrease in our pretax book income. The 2013 effective tax rate of 34.9% applied to pretax book
income was lower than the statutory Federal tax rate of 35% primarily related to the release of valuation allowances for various
state net operating loss carryovers.
As of each reporting date, management considers new evidence, both positive and negative, that could impact its estimate
with regards to future realization of deferred tax assets. As of December 31, 2013, because we implemented a tax planning
strategy that was prudent and feasible in the current year, management determined that sufficient positive evidence existed as of
December 31, 2013, to conclude that it was more likely than not that additional deferred taxes of $3.0 million were realizable,
and therefore, reduced the valuation allowance.
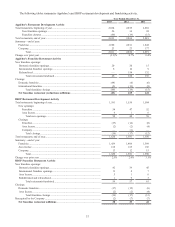
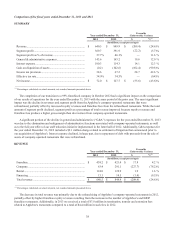
Comparison of the fiscal years ended December 31, 2012 and 2011
SUMMARY
Year ended December 31, Favorable
(Unfavorable) Variance
2012 2011 $%(1)
(In millions, except percentages)
Revenue ................................................................................. $ 849.9 $ 1,075.2 $ (225.3) (24.6)%
Segment profit ....................................................................... 391.9 407.6 (15.7) (3.9)%
Segment profit as % of revenue............................................. 46.1% 37.9% — 21.6 %
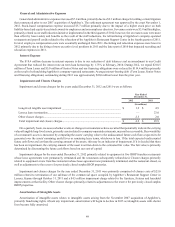
General & administrative expenses ....................................... 163.2 155.8 (7.4) (4.7)%
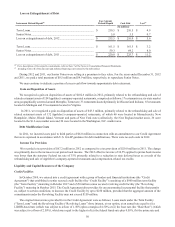
Interest expense ..................................................................... 114.3 132.7 18.4 13.8 %
Impairment and closure charges............................................ 4.2 29.9 25.7 85.9 %
Gain on disposition of assets ................................................. (102.6)(43.3) 59.3 (137.2)%
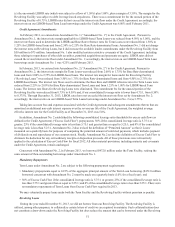
Income tax provision ............................................................. 67.2 29.8 (37.4) (125.6)%
Effective tax rate.................................................................... 34.5% 28.4% (6.1)% (21.5)%
Net income............................................................................. $ 127.7 $ 75.2 $ 52.5 69.8 %
_____________________________________________________
(1) Percentages calculated on actual amounts, not rounded amounts presented above
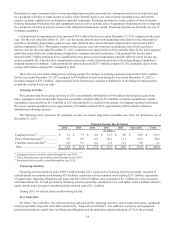
Our 2012 financial results compared to 2011 were significantly impacted by:
• The successful refranchising of 154 Applebee's company-operated restaurants during 2012 that resulted in increased
gains on the disposition of the restaurants partially offset by lower segment profit;
• Lower impairment and closure charges due to non-recurring costs of $27.5 million related to the 2011 termination of
the sublease of Applebee's Restaurant Support Center;
• Lower interest expense due to the ongoing early retirement of debt with both proceeds from the asset dispositions and
excess cash flow;
• G&A expenses increased $7.4 million, primarily due to a $9.1 million charge for settling certain litigation that
commenced prior to our 2007 acquisition of Applebee's; and
• An increased effective tax rate. The 2011 effective tax rate was lower than the statutory Federal tax rate of 35%
primarily due to tax credits, changes in tax rates and the release of liabilities for unrecognized tax benefits. The tax
benefits are primarily FICA tip and other compensation-related credits associated with Applebee's company-operated
restaurants. As company-operated restaurants are refranchised the amount of these credits declines.