IHOP 2013 Annual Report Download - page 60
Download and view the complete annual report
Please find page 60 of the 2013 IHOP annual report below. You can navigate through the pages in the report by either clicking on the pages listed below, or by using the keyword search tool below to find specific information within the annual report.-
 1
1 -
2
-
3
-
4
-
5
-
6
-
7
-
8
-
9
-
10
-
11
-
12
-
13
-
14
-
15
-
16
-
17
-
18
-
19
-
20
-
21
-
22
-
23
-
24
-
25
-
26
-
27
-
28
-
29
-
30
-
31
-
32
-
33
-
34
-
35
-
36
-
37
-
38
-
39
-
40
-
41
-
42
-
43
-
44
-
45
-
46
-
47
-
48
-
49
-
 50
50 -
 51
51 -
 52
52 -
 53
53 -
 54
54 -
 55
55 -
 56
56 -
 57
57 -
 58
58 -
 59
59 -
 60
60 -
 61
61 -
 62
62 -
 63
63 -
 64
64 -
 65
65 -
 66
66 -
 67
67 -
 68
68 -
 69
69 -
 70
70 -
71
-
72
-
73
-
74
-
75
-
76
-
77
-
78
-
79
-
80
-
81
-
82
-
83
-
84
-
85
-
86
-
87
-
88
-
89
-
90
-
91
-
92
-
93
-
94
-
95
-
96
-
97
-
98
-
99
-
100
-
101
-
102
-
103
-
104
-
105
-
106
-
107
-
108
-
109
-
110
-
111
-
112
-
113
-
114
-
115
-
116
-
117
-
118
-
119
-
120
-
121
-
122
-
123
-
124
-
125
-
126
-
127
-
128
-
129
-
130
-
131
-
132
-
133
-
134
-
135
-
136
-
137
-
138
-
139
-
140
-
141
-
142
-
143
 |
 |

39
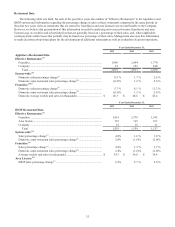
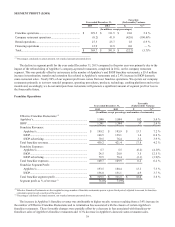
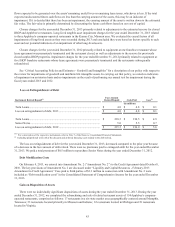
SEGMENT PROFIT (LOSS)
Year ended December 31,
Favorable
(Unfavorable) Variance
2013 2012 $%(1)
(In millions, except percentages)
Franchise operations......................................................... $ 329.5 $ 311.5 $ 18.0 5.8 %
Company restaurant operations........................................ (0.2) 41.8 (42.0) (100.4)%
Rental operations.............................................................. 27.5 25.7 1.8 6.9 %
Financing operations ........................................................ 12.9 12.9 0.0 — %
Total.................................................................................. $ 369.7 $ 391.9 $ (22.2) (5.7)%
_____________________________________________________
(1) Percentages calculated on actual amounts, not rounded amounts presented above
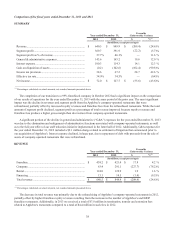
The decline in segment profit for the year ended December 31, 2013 compared to the prior year was primarily due to the
impact of the refranchising of Applebee’s company-operated restaurants, completed in 2012, on the company restaurant
segment. This was partially offset by an increase in the number of Applebee’s and IHOP franchise restaurants, a $3.4 million
increase in termination, transfer and extension fees related to Applebee's restaurants and a 2.4% increase in IHOP domestic
same-restaurant sales. Nearly 90% of our segment profit now comes from our franchise operations. We operate our company
restaurants primarily to test new remodel programs, operating procedures, products, technology, cooking platforms and service
models and, accordingly, we do not anticipate these restaurants will generate a significant amount of segment profit or loss in
the foreseeable future.
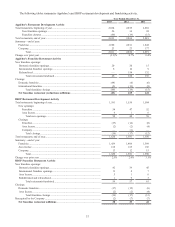
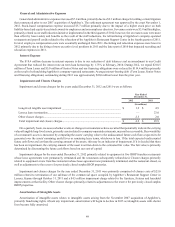
Franchise Operations
Year ended December 31,
Favorable
(Unfavorable) Variance
2013 2012 $%(2)
(In millions, except percentages and number of restaurants)
Effective Franchise Restaurants:(1)
Applebee’s............................................................................ 1,996 1,894 102 5.4 %
IHOP .................................................................................... 1,581 1,544 37 2.4 %
Franchise Revenues:
Applebee’s....................................................................... $ 199.2 $ 185.9 $ 13.3 7.2 %
IHOP................................................................................ 160.5 159.1 1.4 0.8 %
IHOP advertising............................................................. 79.5 76.4 3.1 3.9 %
Total franchise revenues ...................................................... 439.2 421.4 17.8 4.2 %
Franchise Expenses:
Applebee’s....................................................................... 5.7 5.5 (0.2) (4.1)%
IHOP................................................................................ 24.5 28.0 3.5 12.5 %
IHOP advertising............................................................. 79.5 76.4 (3.1) (3.9)%
Total franchise expenses...................................................... 109.7 109.9 0.2 0.2 %
Franchise Segment Profit:
Applebee’s....................................................................... 193.5 180.4 13.1 7.3 %
IHOP................................................................................ 136.0 131.1 4.9 3.7 %
Total franchise segment profit ............................................. $ 329.5 $ 311.5 $ 18.0 5.8 %
Segment profit as % of revenue (2) 75.0% 73.9%
__________________________________________________________________________________________________
(1) Effective Franchise Restaurants are the weighted average number of franchise restaurants open in a given fiscal period, adjusted to account for franchise
restaurants open for only a portion of the period.
(2) Percentages calculated on actual amounts, not rounded amounts presented above.
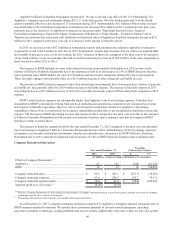
The increase in Applebee’s franchise revenue was attributable to higher royalty revenue resulting from a 5.4% increase in
the number of Effective Franchise Restaurants and to termination fees associated with the closure of certain Applebee's
franchise restaurants. These favorable changes were partially offset by a decrease in fees associated with franchisee-to-
franchisee sales of Applebee's franchise restaurants and 0.3% decrease in Applebee's domestic same-restaurant sales.