IHOP 2013 Annual Report Download - page 43
Download and view the complete annual report
Please find page 43 of the 2013 IHOP annual report below. You can navigate through the pages in the report by either clicking on the pages listed below, or by using the keyword search tool below to find specific information within the annual report.-
 1
1 -
2
-
3
-
4
-
5
-
6
-
7
-
8
-
9
-
10
-
11
-
12
-
13
-
14
-
15
-
16
-
17
-
18
-
19
-
20
-
21
-
22
-
23
-
24
-
25
-
26
-
27
-
28
-
29
-
30
-
31
-
32
-
 33
33 -
 34
34 -
 35
35 -
 36
36 -
 37
37 -
 38
38 -
 39
39 -
 40
40 -
 41
41 -
 42
42 -
 43
43 -
 44
44 -
 45
45 -
 46
46 -
 47
47 -
 48
48 -
 49
49 -
 50
50 -
 51
51 -
 52
52 -
 53
53 -
54
-
55
-
56
-
57
-
58
-
59
-
60
-
61
-
62
-
63
-
64
-
65
-
66
-
67
-
68
-
69
-
70
-
71
-
72
-
73
-
74
-
75
-
76
-
77
-
78
-
79
-
80
-
81
-
82
-
83
-
84
-
85
-
86
-
87
-
88
-
89
-
90
-
91
-
92
-
93
-
94
-
95
-
96
-
97
-
98
-
99
-
100
-
101
-
102
-
103
-
104
-
105
-
106
-
107
-
108
-
109
-
110
-
111
-
112
-
113
-
114
-
115
-
116
-
117
-
118
-
119
-
120
-
121
-
122
-
123
-
124
-
125
-
126
-
127
-
128
-
129
-
130
-
131
-
132
-
133
-
134
-
135
-
136
-
137
-
138
-
139
-
140
-
141
-
142
-
143
 |
 |

22
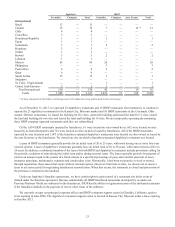
Item 2. Properties.
The table below shows the location and ownership type of Applebee's and IHOP restaurants as of December 31, 2013:
Applebee's IHOP
Franchise Company Total Franchise Company Area License Total
United States
Alabama 30 — 30 21 — — 21
Alaska 2—24——4
Arizona 27 — 27 40 — — 40
Arkansas 11 — 11 15 — — 15
California 117 — 117 229 — — 229
Colorado 25 — 25 31 — — 31
Connecticut 7 — 7 7 — — 7
Delaware 12 — 12 7 — — 7
District of Columbia — — — 2 — — 2
Florida 108 — 108 — — 150 * 150
Georgia 68 — 68 76 — 4 * 80
Hawaii ———6——6
Idaho 12 — 12 8 — — 8
Illinois 47 — 47 52 1 — 53
Indiana 66 — 66 23 — — 23
Iowa 27 — 27 9 — — 9
Kansas 24 10 34 21 1 — 22
Kentucky 37—3771—8
Louisiana 18 — 18 30 — — 30
Maine 12 — 12 1 — — 1
Maryland 26 — 26 38 — — 38
Massachusetts 28 — 28 20 — — 20
Michigan 86 — 86 21 — — 21
Minnesota 58 — 58 12 — — 12
Mississippi 21 — 21 11 — — 11
Missouri 45 13 58 27 — — 27
Montana 8 —8 5— — 5
Nebraska 19 — 19 5 — — 5
Nevada 14 — 14 24 — — 24
New Hampshire 14 — 14 4 — — 4
New Jersey 57 — 57 40 — — 40
New Mexico 18 — 18 20 — — 20
New York 113 — 113 57 — — 57
North Carolina 58 — 58 51 — — 51
North Dakota 12 — 12 2 — — 2
Ohio 93 — 93 22 9 — 31
Oklahoma 23 — 23 28 — — 28
Oregon 21 — 21 7 — — 7
Pennsylvania 77 — 77 17 — — 17
Rhode Island 8 — 8 3 — — 3
South Carolina 40 — 40 29 — — 29
South Dakota 6 — 6 5 — — 5
Tennessee 42 — 42 36 — — 36
Texas 101 — 101 188 — — 188
Utah 16 —1619— —19
Vermont 3—31——1
Virginia 73 — 73 60 — — 60
Washington 42 — 42 32 — — 32
West Virginia 17 — 17 7 — — 7
Wisconsin 44 — 44 14 1 — 15
Wyoming 5 — 5 3 — — 3
Total Domestic 1,838 23 1,861 1,397 13 154 1,564