IHOP 2013 Annual Report Download - page 75
Download and view the complete annual report
Please find page 75 of the 2013 IHOP annual report below. You can navigate through the pages in the report by either clicking on the pages listed below, or by using the keyword search tool below to find specific information within the annual report.-
 1
1 -
2
-
3
-
4
-
5
-
6
-
7
-
8
-
9
-
10
-
11
-
12
-
13
-
14
-
15
-
16
-
17
-
18
-
19
-
20
-
21
-
22
-
23
-
24
-
25
-
26
-
27
-
28
-
29
-
30
-
31
-
32
-
33
-
34
-
35
-
36
-
37
-
38
-
39
-
40
-
41
-
42
-
43
-
44
-
45
-
46
-
47
-
48
-
49
-
50
-
51
-
52
-
53
-
54
-
55
-
56
-
57
-
58
-
59
-
60
-
61
-
62
-
63
-
64
-
 65
65 -
 66
66 -
 67
67 -
 68
68 -
 69
69 -
 70
70 -
 71
71 -
 72
72 -
 73
73 -
 74
74 -
 75
75 -
 76
76 -
 77
77 -
 78
78 -
 79
79 -
 80
80 -
 81
81 -
 82
82 -
 83
83 -
 84
84 -
 85
85 -
86
-
87
-
88
-
89
-
90
-
91
-
92
-
93
-
94
-
95
-
96
-
97
-
98
-
99
-
100
-
101
-
102
-
103
-
104
-
105
-
106
-
107
-
108
-
109
-
110
-
111
-
112
-
113
-
114
-
115
-
116
-
117
-
118
-
119
-
120
-
121
-
122
-
123
-
124
-
125
-
126
-
127
-
128
-
129
-
130
-
131
-
132
-
133
-
134
-
135
-
136
-
137
-
138
-
139
-
140
-
141
-
142
-
143
 |
 |

54
fluctuations in same-restaurant sales as some operating leases include a provision for contingent rent based on retail sales and
by a progressive decline in rental income as leases expire. Rental expenses are costs of prime operating leases and interest
expense on prime capital leases on franchisee-operated restaurants. Financing operations revenue consists of interest income
from the financing of franchise fees and equipment leases as well as periodic sales of equipment. Financing income is impacted
by a progressive decline in interest revenue as the obligations financed are repaid. Financing expenses are primarily the cost of
restaurant equipment.
Cash provided by operating activities increased $74.9 million for the year ended December 31, 2013 compared to the prior
year. For the year ended December 31, 2013, our net income plus the non-cash reconciling items shown in our statements of
cash flows (primarily depreciation, gains on asset sales, deferred taxes and stock-based compensation) increased by $41.8
million compared to 2012. The primary reasons for the increase were lower income tax payments, lower G&A and lower
interest costs for the year ended December 31, 2013 compared to the same period of 2012, partially offset by the lower segment
profit that resulted from the refranchising of Applebee's company-operated restaurants. Cash payments for income taxes
decreased $40.7 million primarily due to significantly lower gains on asset dispositions, partially offset by lower income tax
credits, primarily FICA tip and other compensation-related tax credits, that decreased due to the refranchising of Applebee's
company-operated restaurants. Cash payments for interest decreased $17.1 million compared to 2012 primarily due to lower
average debt balances during 2013 compared to 2012.
There also was a favorable change in net working capital. Net changes in working capital provided cash of $25.1 million
for the year ended December 31, 2013 compared to $8.0 million of cash used during the year ended December 31, 2012, a
favorable change of $33.1 million. Approximately half of the increase was due to differences in the timing of rent payments
around the varying fiscal year ends.
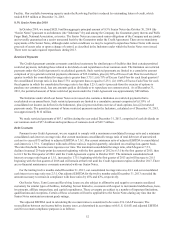
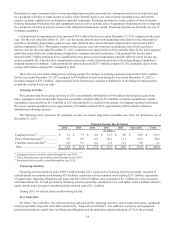
Investing Activities
Net cash provided by investing activities in 2013 was primarily attributable to $14.0 million of principal receipts from
notes, equipment contracts and other long-term receivables, partially offset by $7.0 million of capital expenditures. Capital
expenditures decreased from $17.0 million in 2012 due primarily to a decline in the number of company-operated restaurants.
We expect capital expenditures to be approximately $10 million in fiscal 2014, approximately half of which is related to
information technology projects.
The following table represents the principal receipts on various long-term receivables due from our franchisees as of
December 31, 2013:
Principal Receipts Due By Period
2014 2015 2016 2017 2018 Thereafter Total
(In millions)
Equipment leases(1) ........................ $ 7.1 $ 7.7 $ 8.0 $ 13.5 $ 8.8 $ 70.0 $ 115.1
Direct financing leases(2)................. 7.0 8.0 8.8 10.1 11.1 43.6 88.6
Franchise notes and other(3) .............. 0.8 0.7 0.4 0.1 0.1 0.0 2.1
Total.................................................. $ 14.9 $ 16.4 $ 17.2 $ 23.7 $ 20.0 $ 113.6 $ 205.8
________________________________________________
(1) Equipment lease receivables extend through the year 2029.
(2) Direct financing lease receivables extend through the year 2027.
(3) Franchise note receivables extend through the year 2020.
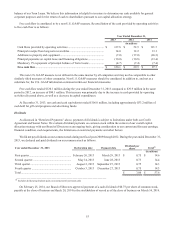
Financing Activities
Financing activities used net cash of $93.3 million during 2013. Cash used in financing activities primarily consisted of
cash dividends on common stock totaling $57.4 million, repurchases of our common stock totaling $29.7 million, repayments
of capital lease, financing obligations and long-term debt of $14.8 million, and a payment of $1.3 million for costs associated
with Amendment No. 2. Cash provided by financing activities primarily consisted of a net cash inflow of $8.6 million related to
equity awards and a decrease in marketing fund restricted cash of $1.2 million.
During 2013, we did not utilize our Revolving Facility.
Free Cash Flow
We define “free cash flow” for a given period as cash provided by operating activities, plus receipts from notes, equipment
contracts and other long-term receivables (collectively, “long-term receivables”), less additions to property and equipment,
principal payments on capital lease and financing obligations and the mandatory annual repayment of 1% of the principal