IHOP 2013 Annual Report Download - page 50
Download and view the complete annual report
Please find page 50 of the 2013 IHOP annual report below. You can navigate through the pages in the report by either clicking on the pages listed below, or by using the keyword search tool below to find specific information within the annual report.-
 1
1 -
2
-
3
-
4
-
5
-
6
-
7
-
8
-
9
-
10
-
11
-
12
-
13
-
14
-
15
-
16
-
17
-
18
-
19
-
20
-
21
-
22
-
23
-
24
-
25
-
26
-
27
-
28
-
29
-
30
-
31
-
32
-
33
-
34
-
35
-
36
-
37
-
38
-
39
-
 40
40 -
 41
41 -
 42
42 -
 43
43 -
 44
44 -
 45
45 -
 46
46 -
 47
47 -
 48
48 -
 49
49 -
 50
50 -
 51
51 -
 52
52 -
 53
53 -
 54
54 -
 55
55 -
 56
56 -
 57
57 -
 58
58 -
 59
59 -
 60
60 -
61
-
62
-
63
-
64
-
65
-
66
-
67
-
68
-
69
-
70
-
71
-
72
-
73
-
74
-
75
-
76
-
77
-
78
-
79
-
80
-
81
-
82
-
83
-
84
-
85
-
86
-
87
-
88
-
89
-
90
-
91
-
92
-
93
-
94
-
95
-
96
-
97
-
98
-
99
-
100
-
101
-
102
-
103
-
104
-
105
-
106
-
107
-
108
-
109
-
110
-
111
-
112
-
113
-
114
-
115
-
116
-
117
-
118
-
119
-
120
-
121
-
122
-
123
-
124
-
125
-
126
-
127
-
128
-
129
-
130
-
131
-
132
-
133
-
134
-
135
-
136
-
137
-
138
-
139
-
140
-
141
-
142
-
143
 |
 |

29
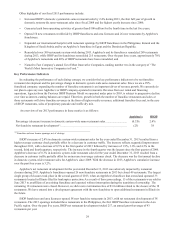
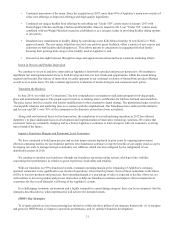
Other highlights of our fiscal 2013 performance include:
• Increased IHOP's domestic systemwide same-restaurant sales by 2.4% during 2013, the first full year of growth in
domestic systemwide same-restaurant sales since fiscal 2008 and the highest yearly increase since 2006;
• Generated cash from operating activities of greater than $100 million for the fourth time in the last five years;
• Opened 58 new restaurants worldwide by IHOP franchisees and area licensees and 26 new restaurants by Applebee's
franchisees;
• Expanded our international footprint with restaurant openings by IHOP franchisees in the Philippines, Kuwait and the
Kingdom of Saudi Arabia and by an Applebee's franchisee in Egypt and the Dominican Republic;
• Remodeled over 500 restaurants system-wide during 2013. Applebee's and its franchisees remodeled 289 restaurants
during 2013, while IHOP and its franchisees remodeled 215 restaurants. Over the past three years, approximately 70%
of Applebee's restaurants and 40% of IHOP restaurants have been remodeled; and
• Named to Fast Company’s annual list of Most Innovative Companies, ranking number two in the category of “The
World’s Most Innovative Companies in Food.”
Key Performance Indicators
In evaluating the performance of each dining concept, we consider the key performance indicators to be net franchise
restaurant development and the percentage change in domestic system-wide same-restaurant sales. Since we are a 99%
franchised company, expanding the number of franchise restaurants is an important driver of revenue growth. We currently do
not plan to open any new Applebee's or IHOP company-operated restaurants. Revenue from our rental and financing
operations, legacies from the Previous IHOP Business Model we operated under prior to 2003, is subject to progressive decline
over time as interest-earning balances are repaid. Therefore, growth in both the number of franchise restaurants and sales at
those restaurants will drive franchise revenues in the form of higher royalty revenues, additional franchise fees and, in the case
of IHOP restaurants, sales of proprietary pancake and waffle dry mix.
An overview of our 2013 performance in these metrics is as follows:
Applebee's IHOP
Percentage (decrease) increase in domestic system-wide same-restaurant sales .............................. (0.3)% 2.4%
Net franchise restaurant development(1) .................................................................................................................... (23) 38
_____________________________________________________
(1) Franchise and area license openings, net of closings
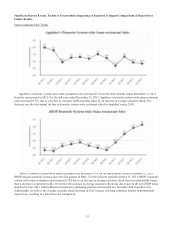
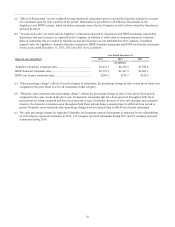
IHOP's increase of 2.4% in domestic system-wide restaurant sales for the year ended December 31, 2013 resulted from a
higher average customer check partially offset by a decrease in customer traffic. The increase reflects sequential improvement
throughout 2013, with a decrease of 0.5% in the first quarter of 2013 followed by increases of 1.9%, 3.6% and 4.5% in the
second, third and fourth quarters, respectively. The increase in the fourth quarter was the largest since the first quarter of 2006.
Applebee's decrease of 0.3% in domestic system-wide restaurant sales for the year ended December 31, 2013 resulted from a
decrease in customer traffic partially offset by an increase in average customer check. The decrease was the first annual decline
in domestic system-wide restaurant sales for Applebee's since 2009. With the decrease in 2013, Applebee's cumulative increase
over the past four years is 3.2%.
Applebee's net restaurant development for the year ended December 31, 2013 was adversely impacted by restaurant
closures during 2013. Applebee's franchisees opened 26 new franchise restaurants in 2013 but closed 49 restaurants. The largest
single group of closures took place in the second quarter of 2013, when an Applebee's franchisee that owned and operated 33
restaurants located in Illinois filed for bankruptcy protection. As a result of those proceedings, 15 of the restaurants were sold in
June 2013 to an affiliate of an existing franchisee and operated without interruption during the transition of ownership. The
remaining 18 restaurants were closed. However, we did receive termination fees of $3.8 million related to the closure of the 18
restaurants. We have entered into a development agreement with the new franchisee to open additional restaurants in Illinois in
the future.
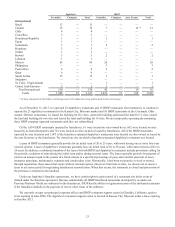
IHOP franchisees and area licensees opened 58 new franchise restaurants in 2013, with net restaurant development of 38
restaurants. The 2013 openings included three restaurants in the Philippines, the first IHOP franchise restaurants in the Asia
Pacific region. Over the past five years, IHOP net restaurant development totaled 217, an annual growth average of 43
restaurants per year.