IHOP 2013 Annual Report Download - page 9
Download and view the complete annual report
Please find page 9 of the 2013 IHOP annual report below. You can navigate through the pages in the report by either clicking on the pages listed below, or by using the keyword search tool below to find specific information within the annual report.-
 1
1 -
 2
2 -
 3
3 -
 4
4 -
 5
5 -
 6
6 -
 7
7 -
 8
8 -
 9
9 -
 10
10 -
 11
11 -
 12
12 -
 13
13 -
 14
14 -
 15
15 -
 16
16 -
 17
17 -
 18
18 -
 19
19 -
 20
20 -
21
-
22
-
23
-
24
-
25
-
26
-
27
-
28
-
29
-
30
-
31
-
32
-
33
-
34
-
35
-
36
-
37
-
38
-
39
-
40
-
41
-
42
-
43
-
44
-
45
-
46
-
47
-
48
-
49
-
50
-
51
-
52
-
53
-
54
-
55
-
56
-
57
-
58
-
59
-
60
-
61
-
62
-
63
-
64
-
65
-
66
-
67
-
68
-
69
-
70
-
71
-
72
-
73
-
74
-
75
-
76
-
77
-
78
-
79
-
80
-
81
-
82
-
83
-
84
-
85
-
86
-
87
-
88
-
89
-
90
-
91
-
92
-
93
-
94
-
95
-
96
-
97
-
98
-
99
-
100
-
101
-
102
-
103
-
104
-
105
-
106
-
107
-
108
-
109
-
110
-
111
-
112
-
113
-
114
-
115
-
116
-
117
-
118
-
119
-
120
-
121
-
122
-
123
-
124
-
125
-
126
-
127
-
128
-
129
-
130
-
131
-
132
-
133
-
134
-
135
-
136
-
137
-
138
-
139
-
140
-
141
-
142
-
143
 |
 |
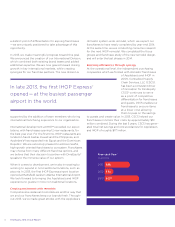
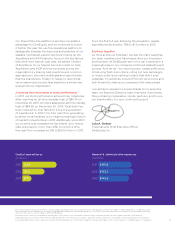
Capital expenditures
(in millions)
2011 $26.36
2012 $17.0
2013 $7.0
General & administrative expenses
(in millions)
2011 $155.8
2012 $163.27
2013 $143.6
5
Our Shared Services platform is another competitive
advantage for DineEquity, and we continued to evolve
it further this year. We use this operational platform to
strategically leverage the resources and expertise of our
scalable, centralized support structure, freeing up the
Applebee’s and IHOP teams to focus on the key factors
that drive their brands. Last year, we added Centers
of Excellence to our Shared Services model, to help
Applebee’s and IHOP achieve synergies across the
organization by sharing best practices and common
approaches to the many challenges and opportunities
that the brands face. Today, I’m happy to report that
we’ve raised resource and idea sharing to a whole new
level across our organization.
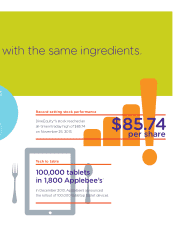
Achieving new milestones in stock performance
In 2013, our stock performance achieved new milestones:
after reaching an all-time intraday high of $85.74 on
November 25, 2013, our stock attained an all-time interday
high of $84.58 on December 26, 2013. Total debt has
been reduced by over $1 billion since the acquisition
of Applebee’s® in 2007. Our free cash flow generating
business model enabled us to initiate a meaningful return
of capital to shareholders in 2013. Additionally, since 2007,
our prudent cost management has helped us to reduce
G&A expenses by more than 25%. During this time,
free cash flow increased by 12% to $120.1 million in 2013.
Since the first full year following the acquisition, capital
expenditures declined by 78% to $7.0 million in 2013.
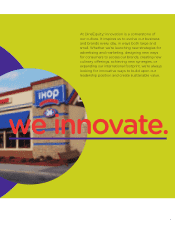
Evolving together
As I look across our business, I can see the many ways that
our team members and franchisees drive our innovation
and evolution. At DineEquity,® each of us can contribute in a
meaningful way to our company’s continued leadership and
success. And we do—by reducing costs, creating efficiency,
introducing fresh menu items, rolling out new campaigns,
or simply putting something in place that didn’t exist
yesterday. I’m extremely proud of how far we’ve come and
look forward to sharing our progress in the years ahead.
I would like to express my sincere thanks to my executive
team, our Board of Directors, team members, franchisees,
the purchasing cooperative, vendor partners, and to you,
our shareholders, for your continued support.
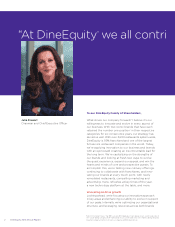
Julia A. Stewart
Chairman and Chief Executive Officer
DineEquity, Inc.
4
Free cash flow for a given period is defined as cash provided by operating activities, plus receipts from notes and equipment contracts receivables, less principal payments on capital lease and
financing obligations, the mandatory 1% of Term Loan principal balance repayment, and capital expenditures. See non-U.S. GAAP financial measure reconciliation of cash provided by operating
activities to free cash flow in the Company’s 2013 Form 10-K filing.
5
The decline in free cash flow in fiscal 2012 was primarily due to the increase in cash taxes paid on refranchising proceeds and, as expected, lower segment profit due to refranchising.
6
Capital expenditures increased from $18.7 million in 2010 due primarily to the remodeling of company-operated restaurants and increases in information technology infrastructure expenditures.
7
General and administrative (“G&A”) expenses increased $7.4 million, primarily due to a $9.1 million charge for settling certain litigation that commenced prior to our 2007 acquisition of Applebee’s.