IHOP 2013 Annual Report Download - page 117
Download and view the complete annual report
Please find page 117 of the 2013 IHOP annual report below. You can navigate through the pages in the report by either clicking on the pages listed below, or by using the keyword search tool below to find specific information within the annual report.-
 1
1 -
2
-
3
-
4
-
5
-
6
-
7
-
8
-
9
-
10
-
11
-
12
-
13
-
14
-
15
-
16
-
17
-
18
-
19
-
20
-
21
-
22
-
23
-
24
-
25
-
26
-
27
-
28
-
29
-
30
-
31
-
32
-
33
-
34
-
35
-
36
-
37
-
38
-
39
-
40
-
41
-
42
-
43
-
44
-
45
-
46
-
47
-
48
-
49
-
50
-
51
-
52
-
53
-
54
-
55
-
56
-
57
-
58
-
59
-
60
-
61
-
62
-
63
-
64
-
65
-
66
-
67
-
68
-
69
-
70
-
71
-
72
-
73
-
74
-
75
-
76
-
77
-
78
-
79
-
80
-
81
-
82
-
83
-
84
-
85
-
86
-
87
-
88
-
89
-
90
-
91
-
92
-
93
-
94
-
95
-
96
-
97
-
98
-
99
-
100
-
101
-
102
-
103
-
104
-
105
-
106
-
 107
107 -
 108
108 -
 109
109 -
 110
110 -
 111
111 -
 112
112 -
 113
113 -
 114
114 -
 115
115 -
 116
116 -
 117
117 -
 118
118 -
 119
119 -
 120
120 -
 121
121 -
 122
122 -
 123
123 -
 124
124 -
 125
125 -
 126
126 -
 127
127 -
128
-
129
-
130
-
131
-
132
-
133
-
134
-
135
-
136
-
137
-
138
-
139
-
140
-
141
-
142
-
143
 |
 |

DineEquity, Inc. and Subsidiaries
Notes to the Consolidated Financial Statements (Continued)
96
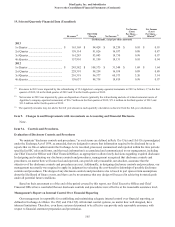
17. Segment Reporting
Information on segments and a reconciliation to income (loss) before income taxes are as follows:
Year Ended December 31,
2013 2012 2011
Revenues (In millions)
Franchise operations ....................................................................................... $ 439.2 $ 421.4 $ 398.5
Company restaurants....................................................................................... 63.4 291.1 531.0
Rental operations............................................................................................. 124.8 122.9 126.0
Financing operations ....................................................................................... 13.1 14.5 19.7
Total............................................................................................................ $ 640.5 $ 849.9 $ 1,075.2
Income (loss) before income taxes
Franchise operations ....................................................................................... $ 329.5 $ 311.5 $ 293.5
Company restaurants....................................................................................... (0.2) 41.8 72.6
Rental operations............................................................................................. 27.5 25.7 27.8
Financing operations ....................................................................................... 12.9 12.9 13.7
Corporate......................................................................................................... (259.1) (197.0) (302.6)
Income (loss) before income taxes ............................................................ $ 110.6 $ 194.9 $ 105.0
Interest expense
Company restaurants....................................................................................... $ 0.4 $ 0.4 $ 0.5
Rental operations............................................................................................. 15.7 17.0 18.0
Corporate......................................................................................................... 100.3 114.3 132.7
Total............................................................................................................ $ 116.4 $ 131.7 $ 151.2
Depreciation and amortization
Franchise operations ....................................................................................... $ 10.8 $ 9.8 $ 9.9
Company restaurants....................................................................................... 2.2 6.9 16.6
Rental operations............................................................................................. 13.4 13.6 14.0
Corporate......................................................................................................... 9.0 9.2 9.7
Total............................................................................................................ $ 35.4 $ 39.5 $ 50.2
Closure and impairment charges
Company restaurants....................................................................................... $ 1.8 $ 4.2 $ 2.4
Corporate......................................................................................................... — — 27.5
Total............................................................................................................ $ 1.8 $ 4.2 $ 29.9
Capital expenditures
Company restaurants....................................................................................... $ 1.3 $ 9.5 $ 15.5
Corporate......................................................................................................... 5.7 7.5 10.8
Total $ 7.0 $ 17.0 $ 26.3
Goodwill (all franchise segment) ................................................................... $ 697.5 $ 697.5 $ 697.5
Total assets
Franchise operations ....................................................................................... $ 1,606.4 $ 1,523.0 $ 1,472.3
Company restaurants....................................................................................... 191.6 186.2 423.1
Rental operations............................................................................................. 364.0 397.3 407.9
Financing operations ....................................................................................... 117.1 125.4 136.4
Corporate......................................................................................................... 125.5 183.5 174.6
Total............................................................................................................ $ 2,404.6 $ 2,415.4 $ 2,614.3
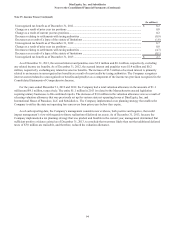
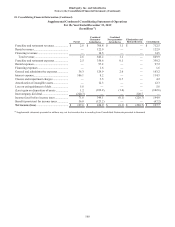
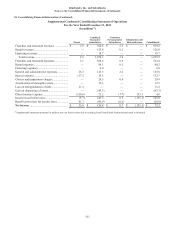
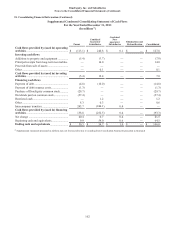
18. Consolidating Financial Information
Certain of our subsidiaries have guaranteed our obligations under the Credit Facility. The following presents the
condensed consolidating financial information separately for: (i) the Parent Company, the issuer of the guaranteed obligations;
(ii) the Guarantor subsidiaries, on a combined basis, as specified in the Credit Agreement; (iii) the Non-guarantor subsidiaries,
on a combined basis; (iv) Consolidating eliminations and reclassification; and (v) DineEquity, Inc. and Subsidiaries on a
consolidated basis. Each guarantor subsidiary is 100% owned by the Parent Company at the date of each balance sheet
presented. The Term Loans under the Credit Facility are fully and unconditionally guaranteed on a joint and several basis by
each guarantor subsidiary. Each entity in the consolidating financial information follows the same accounting policies as
described in the consolidated financial statements.