IHOP 2013 Annual Report Download - page 61
Download and view the complete annual report
Please find page 61 of the 2013 IHOP annual report below. You can navigate through the pages in the report by either clicking on the pages listed below, or by using the keyword search tool below to find specific information within the annual report.-
 1
1 -
2
-
3
-
4
-
5
-
6
-
7
-
8
-
9
-
10
-
11
-
12
-
13
-
14
-
15
-
16
-
17
-
18
-
19
-
20
-
21
-
22
-
23
-
24
-
25
-
26
-
27
-
28
-
29
-
30
-
31
-
32
-
33
-
34
-
35
-
36
-
37
-
38
-
39
-
40
-
41
-
42
-
43
-
44
-
45
-
46
-
47
-
48
-
49
-
50
-
 51
51 -
 52
52 -
 53
53 -
 54
54 -
 55
55 -
 56
56 -
 57
57 -
 58
58 -
 59
59 -
 60
60 -
 61
61 -
 62
62 -
 63
63 -
 64
64 -
 65
65 -
 66
66 -
 67
67 -
 68
68 -
 69
69 -
 70
70 -
 71
71 -
72
-
73
-
74
-
75
-
76
-
77
-
78
-
79
-
80
-
81
-
82
-
83
-
84
-
85
-
86
-
87
-
88
-
89
-
90
-
91
-
92
-
93
-
94
-
95
-
96
-
97
-
98
-
99
-
100
-
101
-
102
-
103
-
104
-
105
-
106
-
107
-
108
-
109
-
110
-
111
-
112
-
113
-
114
-
115
-
116
-
117
-
118
-
119
-
120
-
121
-
122
-
123
-
124
-
125
-
126
-
127
-
128
-
129
-
130
-
131
-
132
-
133
-
134
-
135
-
136
-
137
-
138
-
139
-
140
-
141
-
142
-
143
 |
 |

40
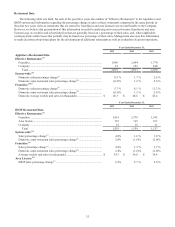
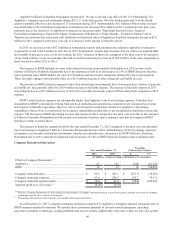
Applebee's Effective Franchise Restaurants increased by 102 due to the full-year effect in 2013 of refranchising 154
Applebee’s company-operated restaurants during 2012 (17 in the first quarter, 98 in the third quarter and 39 in the fourth
quarter), partially offset by a net decrease of 23 restaurants during 2013. Approximately $9.2 million of the revenue increase
was attributable to the refranchised restaurants. Termination fees increased $5.4 million in 2013 compared to the prior year,
primarily due to the closure of 18 Applebee's restaurants as discussed under "Significant Known Events, Trends or
Uncertainties Impacting or Expected to Impact Comparisons of Reported or Future Results - Franchisee Matters" above.
Transfer and extension fees associated with franchisee-to-franchisee sales of Applebee's franchise restaurants decreased $2.0
million in 2013 compared to the prior year, due to a decrease in the amount of transfer activity.
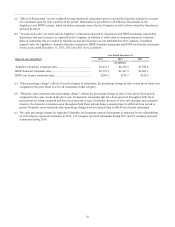
In 2013 we received a total of $7.8 million in termination, transfer and extension fees related to Applebee's restaurants
compared to a total of $4.4 million in such fees in 2012. Termination, transfer and extension fees, by nature, are unpredictable
and variable in any given year; we do not consider the 2013 variances in these fees compared to the prior year to be indicative
of any trend. Further, we do not anticipate the total of such fees that may be received in 2014 will be of the same magnitude as
those received in either 2013 or 2012.
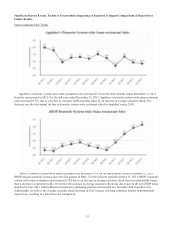
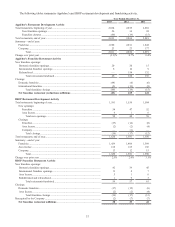
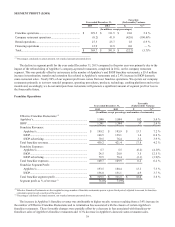
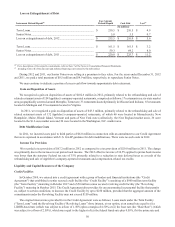
The increase in IHOP franchise revenue (other than advertising) was primarily attributable to a 2.4% increase in the
number of Effective Franchise Restaurants due to development as well as to an increase of 2.4% in IHOP domestic franchise
same-restaurant sales. IHOP added a net total of 38 franchise and area license restaurants during 2013 due to development.
These favorable changes were partially offset by a $2.9 million decrease in sales of pancake and waffle dry mix.
The decrease in IHOP franchise expenses (other than advertising) was primarily due to lower purchase volumes of pancake
and waffle dry mix, partially offset by a $0.9 million increase in bad debt expense. The increase in bad debt expense in 2013
was primarily due to a $0.5 million recovery in 2012 of a receivable previously written off that reduced the comparative 2012
expense.
IHOP’s total franchise expenses are substantially higher than Applebee’s due to advertising expenses. Franchise fees
designated for IHOP’s national advertising fund and local marketing and advertising cooperatives are recognized as revenue
and expense of franchise operations. However, due to our having less contractual control over Applebee’s advertising
expenditures, that activity is considered to be an agency relationship and therefore is not recognized as franchise revenue and
expense. The increases in IHOP advertising revenue and expense in 2013 compared to the prior year were due to the increases
in Effective Franchise Restaurants and the increases in domestic franchise same-restaurant sales that also impacted IHOP
franchise revenue as noted above.
The increase in franchise segment profit for the year ended December 31, 2013 compared to the prior year was primarily
due to an increase in Applebee's Effective Franchise Restaurants because of the refranchising in 2012 of company-operated
restaurants, a net increase in franchise termination, transfer and extension fees, an increase in IHOP's Effective Franchise
Restaurants due to new restaurant development and an increase of 2.4% in IHOP domestic franchise same-restaurant sales.
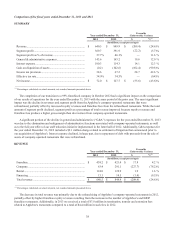
Company Restaurant Operations
Year ended December 31,
Favorable
(Unfavorable) Variance
2013 2012 $%(2)
(In millions, except percentages and number of restaurants)
Effective Company Restaurants:(1)
Applebee’s............................................................................. 23 123 (100) (81.3)%
IHOP...................................................................................... 12 15 (3) (20.0)%
Company restaurant sales ...................................................... $ 63.4 $ 291.1 $ (227.7) (78.2)%
Company restaurant expenses ............................................... 63.6 249.3 185.7 74.5 %
Company restaurant segment profit....................................... $ (0.2) $ 41.8 $ (42.0) (100.4)%
Segment profit as % of revenue (2) (0.2)% 14.4%
_____________________________________________________
(1) Effective Company Restaurants are the weighted average number of company restaurants open in a given fiscal period, adjusted to account for company
restaurants open for only a portion of the period.
(2) Percentages calculated on actual amounts, not rounded amounts presented above.
As of December 31, 2013, company restaurant operations comprised 23 Applebee’s company-operated restaurants and 10
IHOP company-operated restaurants. We operate these restaurants primarily to test new remodel programs, operating
procedures, products, technology, cooking platforms and service models. Additionally, from time to time we may also operate