IHOP 2013 Annual Report Download - page 59
Download and view the complete annual report
Please find page 59 of the 2013 IHOP annual report below. You can navigate through the pages in the report by either clicking on the pages listed below, or by using the keyword search tool below to find specific information within the annual report.-
 1
1 -
2
-
3
-
4
-
5
-
6
-
7
-
8
-
9
-
10
-
11
-
12
-
13
-
14
-
15
-
16
-
17
-
18
-
19
-
20
-
21
-
22
-
23
-
24
-
25
-
26
-
27
-
28
-
29
-
30
-
31
-
32
-
33
-
34
-
35
-
36
-
37
-
38
-
39
-
40
-
41
-
42
-
43
-
44
-
45
-
46
-
47
-
48
-
 49
49 -
 50
50 -
 51
51 -
 52
52 -
 53
53 -
 54
54 -
 55
55 -
 56
56 -
 57
57 -
 58
58 -
 59
59 -
 60
60 -
 61
61 -
 62
62 -
 63
63 -
 64
64 -
 65
65 -
 66
66 -
 67
67 -
 68
68 -
 69
69 -
70
-
71
-
72
-
73
-
74
-
75
-
76
-
77
-
78
-
79
-
80
-
81
-
82
-
83
-
84
-
85
-
86
-
87
-
88
-
89
-
90
-
91
-
92
-
93
-
94
-
95
-
96
-
97
-
98
-
99
-
100
-
101
-
102
-
103
-
104
-
105
-
106
-
107
-
108
-
109
-
110
-
111
-
112
-
113
-
114
-
115
-
116
-
117
-
118
-
119
-
120
-
121
-
122
-
123
-
124
-
125
-
126
-
127
-
128
-
129
-
130
-
131
-
132
-
133
-
134
-
135
-
136
-
137
-
138
-
139
-
140
-
141
-
142
-
143
 |
 |

38
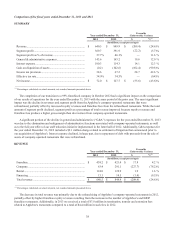
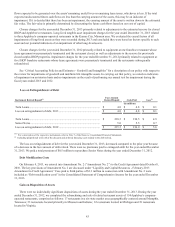
Comparison of the fiscal years ended December 31, 2013 and 2012
SUMMARY
Year ended December 31, Favorable
(Unfavorable) Variance
2013 2012 $ %(1)
(In millions, except percentages)
Revenue ................................................................................. $ 640.5 $ 849.9 $ (209.4) (24.6)%
Segment profit ....................................................................... 369.7 391.9 (22.2) (5.7)%
Segment profit as % of revenue............................................. 57.7% 46.1% — 11.6 %
General & administrative expenses ....................................... 143.6 163.2 19.6 12.0 %
Interest expense ..................................................................... 100.3 114.3 14.1 12.3 %
Gain on disposition of assets ................................................. (0.2)(102.6)(102.4) (99.8)%
Income tax provision ............................................................. 38.6 67.2 28.7 42.6 %
Effective tax rate.................................................................... 34.9% 34.5% — (0.4)%
Net income............................................................................. $ 72.0 $ 127.7 $ (55.6) (43.6)%
_____________________________________________________
(1) Percentages calculated on actual amounts, not rounded amounts presented above
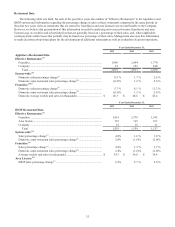
The completion of our transition to a 99% franchised company in October 2012 had a significant impact on the comparison
of our results of operations for the year ended December 31, 2013 with the same period of the prior year. The most significant
impact was the decline in revenues and segment profit from the Applebee's company-operated restaurants that were
refranchised, partially offset by increased royalty revenues and franchise fees from the refranchised restaurants. While the total
amount of segment profit declined, segment profit as a percentage of total revenue improved because royalty revenues and
franchise fees produce a higher gross margin than do revenues from company-operated restaurants.
A significant portion of the decline in general and administrative (“G&A”) expenses for the year ended December 31, 2013
was due to the elimination and realignment of administrative functions associated with company-operated restaurants, as well
as to the full-year effect of our staff reduction initiative implemented in the latter half of 2012. Additionally, G&A expenses for
the year ended December 31, 2012 included a $9.1 million charge related to settlement of litigation that commenced prior to
our acquisition of Applebee's. Interest expense declined, in large part, due to repayment of debt with proceeds from the sale of
assets of company-operated restaurants that were refranchised.
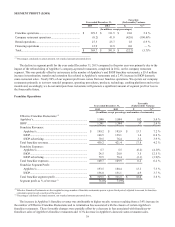
REVENUE
Year ended December 31, Favorable
(Unfavorable) Variance
2013 2012 $ %(1)
(In millions, except percentages)
Franchise................................................................................ $ 439.2 $ 421.4 $ 17.8 4.2 %
Company................................................................................ 63.4 291.1 (227.7) (78.2)%
Rental..................................................................................... 124.8 122.9 1.9 1.6 %
Financing ............................................................................... 13.1 14.5 (1.4) (9.5)%
Total revenue ......................................................................... $ 640.5 $ 849.9 $ (209.4) (24.6)%
_____________________________________________________
(1) Percentages calculated on actual amounts, not rounded amounts presented above
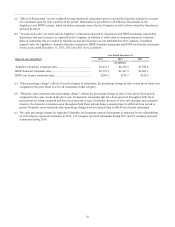
The decrease in total revenue was primarily due to the refranchising of Applebee's company-operated restaurants in 2012,
partially offset by higher franchise royalty revenues resulting from the increase in the number of Applebee’s and IHOP
franchise restaurants. Additionally, in 2013 we received a total of $7.8 million in termination, transfer and extension fees
related to Applebee's restaurants compared to a total of $4.4 million in such fees in 2012.