IHOP 2013 Annual Report Download - page 63
Download and view the complete annual report
Please find page 63 of the 2013 IHOP annual report below. You can navigate through the pages in the report by either clicking on the pages listed below, or by using the keyword search tool below to find specific information within the annual report.-
 1
1 -
2
-
3
-
4
-
5
-
6
-
7
-
8
-
9
-
10
-
11
-
12
-
13
-
14
-
15
-
16
-
17
-
18
-
19
-
20
-
21
-
22
-
23
-
24
-
25
-
26
-
27
-
28
-
29
-
30
-
31
-
32
-
33
-
34
-
35
-
36
-
37
-
38
-
39
-
40
-
41
-
42
-
43
-
44
-
45
-
46
-
47
-
48
-
49
-
50
-
51
-
52
-
 53
53 -
 54
54 -
 55
55 -
 56
56 -
 57
57 -
 58
58 -
 59
59 -
 60
60 -
 61
61 -
 62
62 -
 63
63 -
 64
64 -
 65
65 -
 66
66 -
 67
67 -
 68
68 -
 69
69 -
 70
70 -
 71
71 -
 72
72 -
 73
73 -
74
-
75
-
76
-
77
-
78
-
79
-
80
-
81
-
82
-
83
-
84
-
85
-
86
-
87
-
88
-
89
-
90
-
91
-
92
-
93
-
94
-
95
-
96
-
97
-
98
-
99
-
100
-
101
-
102
-
103
-
104
-
105
-
106
-
107
-
108
-
109
-
110
-
111
-
112
-
113
-
114
-
115
-
116
-
117
-
118
-
119
-
120
-
121
-
122
-
123
-
124
-
125
-
126
-
127
-
128
-
129
-
130
-
131
-
132
-
133
-
134
-
135
-
136
-
137
-
138
-
139
-
140
-
141
-
142
-
143
 |
 |

42
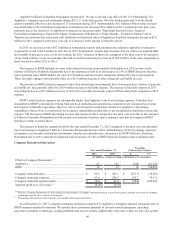
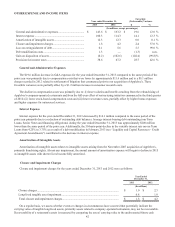
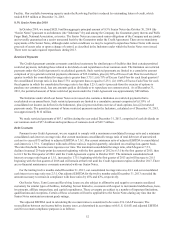
OTHER EXPENSE AND INCOME ITEMS
Year ended December 31,
Favorable
(Unfavorable) Variance
2013 2012 $%
(In millions, except percentages)
General and administrative expenses .................................... $ 143.6 $ 163.2 $ 19.6 12.0 %
Interest expense ..................................................................... 100.3 114.3 14.1 12.3 %
Amortization of intangible assets .......................................... 12.3 12.3 0.0 0.1 %
Closure and impairment charges ........................................... 1.8 4.2 2.4 57.0 %
Loss on extinguishment of debt............................................. 0.1 5.6 5.5 99.0 %
Debt modification costs......................................................... 1.3 — (1.3) n.m.
Gain on disposition of assets ................................................. (0.2)(102.6)(102.4) (99.8)%
Provision for income taxes .................................................... 38.6 67.2 28.7 42.6 %
General and Administrative Expenses
The $19.6 million decrease in G&A expenses for the year ended December 31, 2013 compared to the same period of the
prior year was primarily due to compensation costs that were lower by approximately $11.6 million and to a $9.1 million
charge recorded in 2012 related to settlement of litigation that commenced prior to our acquisition of Applebee's. These
favorable variances were partially offset by a $1.2 million increase in consumer research costs.
The decline in compensation costs was primarily due to: (i) lower salaries and benefits resulting from the refranchising of
Applebee's company-operated restaurants and from the full-year effect of restructuring initiatives announced in the third quarter
of 2012; (ii) lower stock-based compensation costs and (iii) lower severance costs, partially offset by higher bonus expenses
and higher expenses for outsourced services.
Interest Expense
Interest expense for the year ended December 31, 2013 decreased by $14.1 million compared to the same period of the
prior year primarily due to a reduction of outstanding debt balances. Average interest-bearing debt outstanding (our Term
Loans, Senior Notes and financing obligations) during the year ended December 31, 2013 was approximately $200 million
lower than the same period of the prior year. Additionally, the 50-basis-point-decline in the variable interest rate on our Term
Loans from 4.25% to 3.75% as a result of a debt modification in February 2013 (see “Liquidity and Capital Resources - Credit
Agreement Amendments”) contributed to the decrease in interest expense.
Amortization of Intangible Assets
Amortization of intangible assets relates to intangible assets arising from the November 2007 acquisition of Applebee's,
primarily franchising rights. Absent any impairment, the annual amount of amortization expense will begin to decline in 2015
as intangible assets with shorter lives become fully amortized.
Closure and Impairment Charges
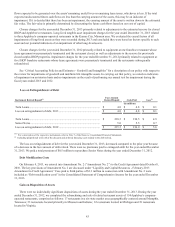
Closure and impairment charges for the years ended December 31, 2013 and 2012 were as follows:
Year Ended
December 31,
2013 2012
(In millions)
Closure charges.................................................................................................................. $ 1.0 $ 2.3
Long-lived tangible asset impairment................................................................................ 0.8 1.9
Total closure and impairment charges............................................................................... $ 1.8 $ 4.2
On a regular basis, we assess whether events or changes in circumstances have occurred that potentially indicate the
carrying value of tangible long-lived assets, primarily assets related to company-operated restaurants, may not be recoverable.
Recoverability of a restaurant's assets is measured by comparing the assets' carrying value to the undiscounted future cash