IHOP 2013 Annual Report Download - page 134
Download and view the complete annual report
Please find page 134 of the 2013 IHOP annual report below. You can navigate through the pages in the report by either clicking on the pages listed below, or by using the keyword search tool below to find specific information within the annual report.-
 1
1 -
2
-
3
-
4
-
5
-
6
-
7
-
8
-
9
-
10
-
11
-
12
-
13
-
14
-
15
-
16
-
17
-
18
-
19
-
20
-
21
-
22
-
23
-
24
-
25
-
26
-
27
-
28
-
29
-
30
-
31
-
32
-
33
-
34
-
35
-
36
-
37
-
38
-
39
-
40
-
41
-
42
-
43
-
44
-
45
-
46
-
47
-
48
-
49
-
50
-
51
-
52
-
53
-
54
-
55
-
56
-
57
-
58
-
59
-
60
-
61
-
62
-
63
-
64
-
65
-
66
-
67
-
68
-
69
-
70
-
71
-
72
-
73
-
74
-
75
-
76
-
77
-
78
-
79
-
80
-
81
-
82
-
83
-
84
-
85
-
86
-
87
-
88
-
89
-
90
-
91
-
92
-
93
-
94
-
95
-
96
-
97
-
98
-
99
-
100
-
101
-
102
-
103
-
104
-
105
-
106
-
107
-
108
-
109
-
110
-
111
-
112
-
113
-
114
-
115
-
116
-
117
-
118
-
119
-
120
-
121
-
122
-
123
-
 124
124 -
 125
125 -
 126
126 -
 127
127 -
 128
128 -
 129
129 -
 130
130 -
 131
131 -
 132
132 -
 133
133 -
 134
134 -
 135
135 -
 136
136 -
 137
137 -
 138
138 -
 139
139 -
 140
140 -
 141
141 -
 142
142 -
 143
143
 |
 |

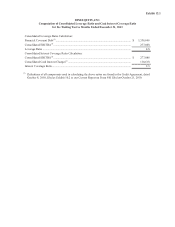
Exhibit 12.1
DINEEQUITY, INC.
Computation of Consolidated Leverage Ratio and Cash Interest Coverage Ratio
for the Trailing Twelve Months Ended December 31, 2013
Consolidated Leverage Ratio Calculation:
Financial Covenant Debt(1) ......................................................................................................... $ 1,336,666
Consolidated EBITDA(1) ............................................................................................................ 277,088
Leverage Ratio ........................................................................................................................... 4.8
Consolidated Interest Coverage Ratio Calculation:
Consolidated EBITDA(1) ............................................................................................................ $ 277,088
Consolidated Cash Interest Charges(1)........................................................................................ 110,618
Interest Coverage Ratio.............................................................................................................. 2.5
(1) Definitions of all components used in calculating the above ratios are found in the Credit Agreement, dated
October 8, 2010, filed as Exhibit 10.2 to our Current Report on Form 8-K filed on October 21, 2010.