IHOP 2013 Annual Report Download - page 86
Download and view the complete annual report
Please find page 86 of the 2013 IHOP annual report below. You can navigate through the pages in the report by either clicking on the pages listed below, or by using the keyword search tool below to find specific information within the annual report.-
 1
1 -
2
-
3
-
4
-
5
-
6
-
7
-
8
-
9
-
10
-
11
-
12
-
13
-
14
-
15
-
16
-
17
-
18
-
19
-
20
-
21
-
22
-
23
-
24
-
25
-
26
-
27
-
28
-
29
-
30
-
31
-
32
-
33
-
34
-
35
-
36
-
37
-
38
-
39
-
40
-
41
-
42
-
43
-
44
-
45
-
46
-
47
-
48
-
49
-
50
-
51
-
52
-
53
-
54
-
55
-
56
-
57
-
58
-
59
-
60
-
61
-
62
-
63
-
64
-
65
-
66
-
67
-
68
-
69
-
70
-
71
-
72
-
73
-
74
-
75
-
 76
76 -
 77
77 -
 78
78 -
 79
79 -
 80
80 -
 81
81 -
 82
82 -
 83
83 -
 84
84 -
 85
85 -
 86
86 -
 87
87 -
 88
88 -
 89
89 -
 90
90 -
 91
91 -
 92
92 -
 93
93 -
 94
94 -
 95
95 -
 96
96 -
97
-
98
-
99
-
100
-
101
-
102
-
103
-
104
-
105
-
106
-
107
-
108
-
109
-
110
-
111
-
112
-
113
-
114
-
115
-
116
-
117
-
118
-
119
-
120
-
121
-
122
-
123
-
124
-
125
-
126
-
127
-
128
-
129
-
130
-
131
-
132
-
133
-
134
-
135
-
136
-
137
-
138
-
139
-
140
-
141
-
142
-
143
 |
 |

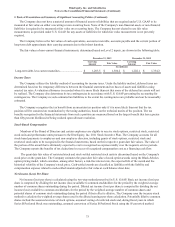
65
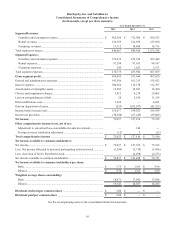
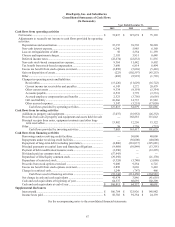
DineEquity, Inc. and Subsidiaries
Consolidated Statements of Comprehensive Income
(In thousands, except per share amounts)
Year Ended December 31,
2013 2012 2011
Segment Revenues:
Franchise and restaurant revenues................................................................ $ 502,586 $ 712,580 $ 929,523
Rental revenues ............................................................................................ 124,769 122,859 125,960
Financing revenues....................................................................................... 13,112 14,489 19,715
Total segment revenues..................................................................................... 640,467 849,928 1,075,198
Segment Expenses:
Franchise and restaurant expenses ............................................................... 173,232 359,196 563,449
Rental expenses ............................................................................................ 97,298 97,165 98,147
Financing expenses ...................................................................................... 245 1,623 5,973
Total segment expenses..................................................................................... 270,775 457,984 667,569
Gross segment profit....................................................................................... 369,692 391,944 407,629
General and administrative expenses................................................................ 143,586 163,215 155,822
Interest expense................................................................................................. 100,264 114,338 132,707
Amortization of intangible assets...................................................................... 12,282 12,293 12,300
Closure and impairment charges....................................................................... 1,812 4,218 29,865
Loss on extinguishment of debt ........................................................................ 58 5,554 11,159
Debt modification costs .................................................................................... 1,296 — 4,031
Gain on disposition of assets............................................................................. (223)(102,597)(43,253)
Income before income taxes ............................................................................. 110,617 194,923 104,998
Income tax provision......................................................................................... (38,580)(67,249)(29,806)
Net income ....................................................................................................... 72,037 127,674 75,192
Other comprehensive income (loss), net of tax:
Adjustment to unrealized loss on available-for-sale investments ................. — 140 —
Foreign currency translation adjustment ....................................................... (12)2
(12)
Total comprehensive income.......................................................................... $ 72,025 $ 127,816 $ 75,180
Net income available to common stockholders:
Net income ........................................................................................................ $ 72,037 $ 127,674 $ 75,192
Less: Net income allocated to unvested participating restricted stock ............. (1,200)(2,718)(1,886)
Less: Accretion of Series B preferred stock...................................................... —(2,498)(2,573)
Net income available to common stockholders ................................................ $ 70,837 $ 122,458 $ 70,733
Net income available to common stockholders per share:
Basic .............................................................................................................. $ 3.75 $ 6.81 $ 3.96
Diluted ........................................................................................................... $ 3.70 $ 6.63 $ 3.89
Weighted average shares outstanding:
Basic .............................................................................................................. 18,871 17,992 17,846
Diluted ........................................................................................................... 19,141 18,877 18,185
Dividends declared per common share ......................................................... $ 3.00 $ — $ —
Dividends paid per common share ................................................................ $ 3.00 $ — $ —
See the accompanying notes to the consolidated financial statements.