IHOP 2013 Annual Report Download - page 74
Download and view the complete annual report
Please find page 74 of the 2013 IHOP annual report below. You can navigate through the pages in the report by either clicking on the pages listed below, or by using the keyword search tool below to find specific information within the annual report.-
 1
1 -
2
-
3
-
4
-
5
-
6
-
7
-
8
-
9
-
10
-
11
-
12
-
13
-
14
-
15
-
16
-
17
-
18
-
19
-
20
-
21
-
22
-
23
-
24
-
25
-
26
-
27
-
28
-
29
-
30
-
31
-
32
-
33
-
34
-
35
-
36
-
37
-
38
-
39
-
40
-
41
-
42
-
43
-
44
-
45
-
46
-
47
-
48
-
49
-
50
-
51
-
52
-
53
-
54
-
55
-
56
-
57
-
58
-
59
-
60
-
61
-
62
-
63
-
 64
64 -
 65
65 -
 66
66 -
 67
67 -
 68
68 -
 69
69 -
 70
70 -
 71
71 -
 72
72 -
 73
73 -
 74
74 -
 75
75 -
 76
76 -
 77
77 -
 78
78 -
 79
79 -
 80
80 -
 81
81 -
 82
82 -
 83
83 -
 84
84 -
85
-
86
-
87
-
88
-
89
-
90
-
91
-
92
-
93
-
94
-
95
-
96
-
97
-
98
-
99
-
100
-
101
-
102
-
103
-
104
-
105
-
106
-
107
-
108
-
109
-
110
-
111
-
112
-
113
-
114
-
115
-
116
-
117
-
118
-
119
-
120
-
121
-
122
-
123
-
124
-
125
-
126
-
127
-
128
-
129
-
130
-
131
-
132
-
133
-
134
-
135
-
136
-
137
-
138
-
139
-
140
-
141
-
142
-
143
 |
 |

53
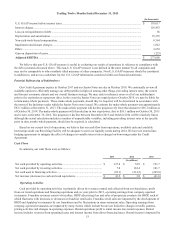
Trailing Twelve Months Ended December 31, 2013
(In thousands)
U.S. GAAP income before income taxes............................................................................................................... $ 110,617
Interest charges....................................................................................................................................................... 116,453
Loss on extinguishment of debt ............................................................................................................................. 58
Depreciation and amortization ............................................................................................................................... 35,355
Non-cash stock-based compensation ..................................................................................................................... 9,364
Impairment and closure charges............................................................................................................................. 1,812
Other....................................................................................................................................................................... 3,652
Gain on disposition of assets.................................................................................................................................. (223)
Adjusted EBITDA ................................................................................................................................................ $ 277,088
We believe this non-U.S. GAAP measure is useful in evaluating our results of operations in reference to compliance with
the debt covenants discussed above. This non-U.S. GAAP measure is not defined in the same manner by all companies and
may not be comparable to other similarly titled measures of other companies. Non-U.S. GAAP measures should be considered
in addition to, and not as a substitute for, the U.S. GAAP information contained within our financial statements.
Potential Refinancing of Indebtedness
Our Credit Agreement expires in October 2017 and our Senior Notes are due in October 2018. We continually review all
available options to efficiently manage our debt portfolio in light of, among other things, prevailing interest rates, the current
and forecast economic climate and our overall business strategy. We may seek to refinance some or all of our indebtedness
prior to the expiration or repayment dates. In the event the Senior Notes are repaid prior to October 2018, we may be liable for
certain make-whole payments. These make-whole payments, should they be required, will be determined in accordance with
the terms of the Indenture under which the Senior Notes were issued. We estimate the make-whole payment was approximately
$92.1 million at December 31, 2013. The make-whole payment will decline progressively from that amount to $36.1 million as
of October 30, 2014. The make-whole payment will then decline in two step-downs, first to $18.1 million on October 30, 2015
and to zero on October 30, 2016. The progressive decline between December 2013 and October 2014 will be relatively linear,
although the actual calculation includes a number of unpredictable variables, including prevailing interest rates at the specific
point in time a make-whole payment, should one be required, is calculated.
Based on our current level of operations, we believe that our cash flow from operations, available cash and available
borrowings under our Revolving Facility will be adequate to meet our liquidity needs during 2014. We have not entered into
hedging agreements to mitigate the effect of changes in variable interest rates charged on borrowings under the Credit
Agreement.
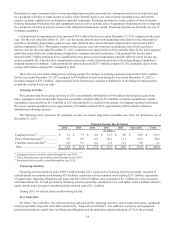
Cash Flows
In summary, our cash flows were as follows:
2013 2012 2011
(In millions)
Net cash provided by operating activities ....................................................... $ 127.8 $ 52.9 $ 121.7
Net cash provided by investing activities ....................................................... 7.0 165.4 101.7
Net cash used in financing activities............................................................... (93.3)(214.5)(265.0)
Net increase (decrease) in cash and cash equivalents ..................................... $ 41.5 $ 3.8 $ (41.6)
Operating Activities
Cash provided by operating activities is primarily driven by revenues earned and collected from our franchisees, profit
from our rental operations and financing operations and, in years prior to 2013, operating earnings from company-operated
restaurants. Franchise revenues consist of royalties, IHOP advertising fees and sales of proprietary products for IHOP, each of
which fluctuates with increases or decreases in franchise retail sales. Franchise retail sales are impacted by the development of
IHOP and Applebee's restaurants by our franchisees and by fluctuations in same-restaurant sales. Operating earnings from
company-operated restaurants are impacted by many factors which include but are not limited to changes in traffic patterns,
pricing activities and changes in operating expenses. Rental operations profit is rental income less rental expenses. Rental
income includes revenues from operating leases and interest income from direct financing leases. Rental income is impacted by