IHOP 2013 Annual Report Download - page 62
Download and view the complete annual report
Please find page 62 of the 2013 IHOP annual report below. You can navigate through the pages in the report by either clicking on the pages listed below, or by using the keyword search tool below to find specific information within the annual report.-
 1
1 -
2
-
3
-
4
-
5
-
6
-
7
-
8
-
9
-
10
-
11
-
12
-
13
-
14
-
15
-
16
-
17
-
18
-
19
-
20
-
21
-
22
-
23
-
24
-
25
-
26
-
27
-
28
-
29
-
30
-
31
-
32
-
33
-
34
-
35
-
36
-
37
-
38
-
39
-
40
-
41
-
42
-
43
-
44
-
45
-
46
-
47
-
48
-
49
-
50
-
51
-
 52
52 -
 53
53 -
 54
54 -
 55
55 -
 56
56 -
 57
57 -
 58
58 -
 59
59 -
 60
60 -
 61
61 -
 62
62 -
 63
63 -
 64
64 -
 65
65 -
 66
66 -
 67
67 -
 68
68 -
 69
69 -
 70
70 -
 71
71 -
 72
72 -
73
-
74
-
75
-
76
-
77
-
78
-
79
-
80
-
81
-
82
-
83
-
84
-
85
-
86
-
87
-
88
-
89
-
90
-
91
-
92
-
93
-
94
-
95
-
96
-
97
-
98
-
99
-
100
-
101
-
102
-
103
-
104
-
105
-
106
-
107
-
108
-
109
-
110
-
111
-
112
-
113
-
114
-
115
-
116
-
117
-
118
-
119
-
120
-
121
-
122
-
123
-
124
-
125
-
126
-
127
-
128
-
129
-
130
-
131
-
132
-
133
-
134
-
135
-
136
-
137
-
138
-
139
-
140
-
141
-
142
-
143
 |
 |

41
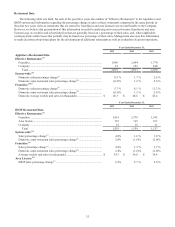
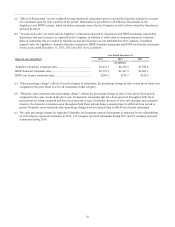
restaurants reacquired from IHOP franchisees on a temporary basis until those restaurants are refranchised. There were three
such temporarily operated IHOP restaurants at December 31, 2013. Applebee's Effective Company Restaurants for the year
ended December 31, 2012 include the 154 restaurants refranchised as noted under “Franchise Operations” above for the period
of time they were operated as company restaurants.
Company restaurant sales and expenses for the year ended December 31, 2013 decreased $224.0 million and $184.2
million, respectively, because of the refranchising of 154 Applebee's company-operated restaurants in 2012.
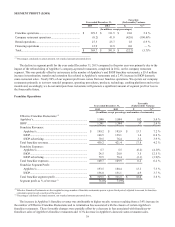
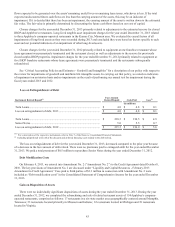
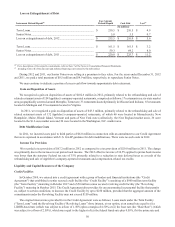
Rental Operations
Year ended December 31,
Favorable
(Unfavorable) Variance
2013 2012 $ %(1)
(In millions, except percentages)
Rental revenues ..................................................................... $ 124.8 $ 122.9 $ 1.9 1.6 %
Rental expenses ..................................................................... 97.3 97.2 (0.1) (0.1)%
Rental operations segment profit........................................... $ 27.5 $ 25.7 $ 1.8 6.9 %
Segment profit as % of revenue (1) 22.0% 20.9%
_____________________________________________________
(1) Percentages calculated on actual amounts, not rounded amounts presented above
Rental operations relate primarily to IHOP franchise restaurants that were developed under the Previous IHOP Business
Model described under Item 1. - Business. Rental income includes revenue from operating leases and interest income from
direct financing leases. Rental expenses are costs of prime operating leases and interest expense on prime capital leases on
certain franchise restaurants.
Rental revenue for the year ended December 31, 2013 increased due to a $3.0 million increase in contractual and
contingent rent, partially offset by a $0.7 million decline in interest income as direct financing leases are repaid and a $0.7
million increase in the write-off of deferred lease revenue associated with franchise restaurants whose lease agreements were
prematurely terminated. Rental expenses for the year ended December 31, 2013 increased slightly as a $1.3 million increase in
contractual and contingent prime rent costs were substantially offset by a decrease in interest on capital lease obligations. The
increase in rental segment profit for the year ended December 31, 2013 was primarily due to the increase in contractual and
contingent rent and the net favorable change in interest revenue and expense, partially offset by the increase in write-offs of
deferred lease revenue associated with franchise restaurants whose lease agreements were prematurely terminated.
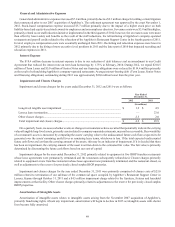
Financing Operations
Year ended December 31, Favorable
(Unfavorable) Variance
2013 2012 $ %(1)
(In millions, except percentages)
Financing revenues................................................................ $ 13.1 $ 14.5 $ (1.4) (9.5)%
Financing expenses................................................................ 0.2 1.6 1.4 84.9 %
Financing operations segment profit ..................................... $ 12.9 $ 12.9 $ 0.0 — %
Segment profit as % of revenue (1) 98.1% 88.8%
_____________________________________________________
(1) Percentages calculated on actual amounts, not rounded amounts presented above
Financing operations relate primarily to IHOP franchise restaurants that were developed under the Previous IHOP Business
Model described under Item 1. - Business. Financing operations revenue primarily consists of interest income from the
financing of franchise fees and equipment leases, as well as sales of equipment associated with IHOP restaurants reacquired by
us. Financing expenses are primarily the cost of restaurant equipment sold associated with reacquired IHOP restaurants.
The decrease in financing revenue for the year ended December 31, 2013 was due to a $1.0 million decrease in interest
revenue resulting from the progressive decline in note balances due to repayments and less sales activity related to IHOP
restaurants reacquired from franchisees. The decrease in financing expenses for the year ended December 31, 2013 was due to
less sales activity related to IHOP restaurants reacquired from franchisees. Sales of equipment associated with reacquired IHOP
restaurants are, by nature, unpredictable and variable in any given year.