IBM 2002 Annual Report Download - page 99
Download and view the complete annual report
Please find page 99 of the 2002 IBM annual report below. You can navigate through the pages in the report by either clicking on the pages listed below, or by using the keyword search tool below to find specific information within the annual report.-
 1
1 -
2
-
3
-
4
-
5
-
6
-
7
-
8
-
9
-
10
-
11
-
12
-
13
-
14
-
15
-
16
-
17
-
18
-
19
-
20
-
21
-
22
-
23
-
24
-
25
-
26
-
27
-
28
-
29
-
30
-
31
-
32
-
33
-
34
-
35
-
36
-
37
-
38
-
39
-
40
-
41
-
42
-
43
-
44
-
45
-
46
-
47
-
48
-
49
-
50
-
51
-
52
-
53
-
54
-
55
-
56
-
57
-
58
-
59
-
60
-
61
-
62
-
63
-
64
-
65
-
66
-
67
-
68
-
69
-
70
-
71
-
72
-
73
-
74
-
75
-
76
-
77
-
78
-
79
-
80
-
81
-
82
-
83
-
84
-
85
-
86
-
87
-
88
-
 89
89 -
 90
90 -
 91
91 -
 92
92 -
 93
93 -
 94
94 -
 95
95 -
 96
96 -
 97
97 -
 98
98 -
 99
99 -
 100
100 -
 101
101 -
 102
102 -
 103
103 -
 104
104 -
 105
105 -
 106
106 -
 107
107 -
 108
108 -
 109
109 -
110
-
111
-
112
 |
 |

Notes to Consolidated Financial Statements
97international business machines corporation and Subsidiary Companies
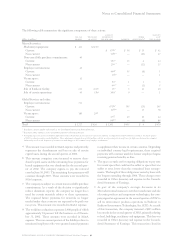
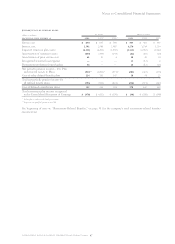
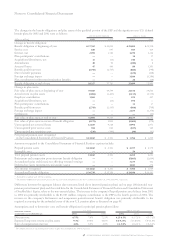
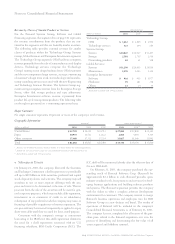
(income)/cost of pension plans
(dollars in millions) u.s. plans non-u.s. plans
for the year ended december 31: 2002 2001*2000*2002 2001 2000
Service cost $«««««650 $««««647 $««««586 $««««505 $««««429 $««««445
Interest cost 2,591 2,560 2,485 1,270 1,214 1,234
Expected return on plan assets (4,121) (4,202) (3,902) (2,132) (2,062) (2,042)
Amortization of transition assets (144) (143) (144) (12) (10) (10)
Amortization of prior service cost 61 52 4 28 28 24
Recognized actuarial losses/(gains) ——— 33 (12) 4
Divestitures/settlement losses/(gains) 46 —— 26 (12) (25)
Net periodic pension income
—
U.S. Plan
and material non-U.S. Plans «(917) ** «÷(1,086) ** «÷(971) ** «÷(282) «÷(425) «÷(370)
Cost of other defined benefit plans 124 141 147 58 54 23
Total net periodic pension income for
all defined benefit plans ««««(793) ÷«(945) «÷(824) ÷«(224) «««(371) «÷(347)
Cost of defined contribution plans ÷«««315 ««««313 ««««294 ÷««178 ÷««162 ««««149
Total retirement plan income recognized
in the Consolidated Statement of Earnings $««««(478) $«««(632) $«««(530) $«««««(46) $«««(209) $«««(198)
*Reclassified to conform with 2002 presentation.
** Represents the qualified portion of the PPP.
See beginning of note w, “Retirement-Related Benefits,” on page 95 for the company’s total retirement-related benefits
(income)/cost.