IBM 2002 Annual Report Download - page 107
Download and view the complete annual report
Please find page 107 of the 2002 IBM annual report below. You can navigate through the pages in the report by either clicking on the pages listed below, or by using the keyword search tool below to find specific information within the annual report.-
 1
1 -
2
-
3
-
4
-
5
-
6
-
7
-
8
-
9
-
10
-
11
-
12
-
13
-
14
-
15
-
16
-
17
-
18
-
19
-
20
-
21
-
22
-
23
-
24
-
25
-
26
-
27
-
28
-
29
-
30
-
31
-
32
-
33
-
34
-
35
-
36
-
37
-
38
-
39
-
40
-
41
-
42
-
43
-
44
-
45
-
46
-
47
-
48
-
49
-
50
-
51
-
52
-
53
-
54
-
55
-
56
-
57
-
58
-
59
-
60
-
61
-
62
-
63
-
64
-
65
-
66
-
67
-
68
-
69
-
70
-
71
-
72
-
73
-
74
-
75
-
76
-
77
-
78
-
79
-
80
-
81
-
82
-
83
-
84
-
85
-
86
-
87
-
88
-
89
-
90
-
91
-
92
-
93
-
94
-
95
-
96
-
 97
97 -
 98
98 -
 99
99 -
 100
100 -
 101
101 -
 102
102 -
 103
103 -
 104
104 -
 105
105 -
 106
106 -
 107
107 -
 108
108 -
 109
109 -
 110
110 -
 111
111 -
 112
112
 |
 |

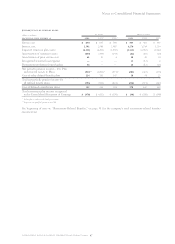
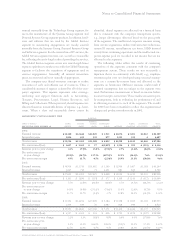
105international business machines corporation and Subsidiary Companies
Five-Year Comparison of Selected Financial Data
(dollars in millions except per share amounts)
for the year: 2002 2001 2000 1999 1998
Revenue $«81,186 $«83,067 $«85,089 $«83,334 $«77,548
Income from continuing operations 5,334 8,146 7,874 7,359 5,469
(Loss)/income from discontinued operations (1,755) (423) 219 353 859
Net income 3,579 7,723 8,093 7,712 6,328
Earnings/(loss) per share of common stock:
Assuming dilution:
Continuing operations 3.07 4.59 4.32 3.93 2.84
Discontinued operations (1.01) (0.24) 0.12 0.19 0.45
Total 2.06 4.35 4.44 4.12 3.29
Basic:
Continuing operations 3.13 4.69 4.45 4.06 2.92
Discontinued operations (1.03) (0.24) 0.12 0.20 0.46
Total 2.10 4.45 4.58*4.25*3.38
Cash dividends paid on common stock 1,005 956 909 859 814
Per share of common stock 0.59 0.55 0.51 0.47 0.43
Investment in plant, rental machines
and other property 5,022 5,660 5,616 5,959 6,520
Return on stockholders’ equity 15.5% 35.3% ** 40.0% ** 39.1% ** 32.7% **
at end of year:
Total assets $«96,484 $«90,303** $«90,412** $«89,571** $«88,160**
Net investment in plant, rental machines
and other property 14,440 16,504 16,714 17,590 19,631
Working capital 7,102 7,342 7,474 3,577 5,533
Total debt 26,017 27,151 28,576 28,354 29,413
Stockholders’ equity 22,782 23,448** 20,550** 20,426** 19,383**
*Does not total due to rounding.
** Reclassified to conform with 2002 presentation.