IBM 2002 Annual Report Download - page 59
Download and view the complete annual report
Please find page 59 of the 2002 IBM annual report below. You can navigate through the pages in the report by either clicking on the pages listed below, or by using the keyword search tool below to find specific information within the annual report.-
 1
1 -
2
-
3
-
4
-
5
-
6
-
7
-
8
-
9
-
10
-
11
-
12
-
13
-
14
-
15
-
16
-
17
-
18
-
19
-
20
-
21
-
22
-
23
-
24
-
25
-
26
-
27
-
28
-
29
-
30
-
31
-
32
-
33
-
34
-
35
-
36
-
37
-
38
-
39
-
40
-
41
-
42
-
43
-
44
-
45
-
46
-
47
-
48
-
 49
49 -
 50
50 -
 51
51 -
 52
52 -
 53
53 -
 54
54 -
 55
55 -
 56
56 -
 57
57 -
 58
58 -
 59
59 -
 60
60 -
 61
61 -
 62
62 -
 63
63 -
 64
64 -
 65
65 -
 66
66 -
 67
67 -
 68
68 -
 69
69 -
70
-
71
-
72
-
73
-
74
-
75
-
76
-
77
-
78
-
79
-
80
-
81
-
82
-
83
-
84
-
85
-
86
-
87
-
88
-
89
-
90
-
91
-
92
-
93
-
94
-
95
-
96
-
97
-
98
-
99
-
100
-
101
-
102
-
103
-
104
-
105
-
106
-
107
-
108
-
109
-
110
-
111
-
112
 |
 |

Management Discussion
57international business machines corporation and Subsidiary Companies
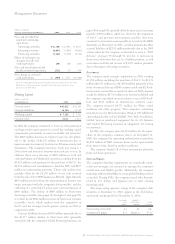
(dollars in millions)
at december 31: 2002 2001
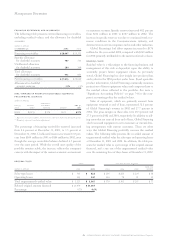
Total company debt $«26,017 $«27,151
Non-global financing debt*$«««2,189 $«««1,606
Non-global financing debt/
capitalization 10.2% 7.5%
*Non-global financing debt is the company’s total external debt less the Global Financing
debt described in the Global Financing balance sheet on page 61.
The company’s non-global financing businesses generate
significant cash from ongoing operations and therefore gen-
erally do not require a significant amount of debt. Cash flows
from operations are these businesses’ primary source of funds
for future investments.
The increase in the non-global financing debt was driven
primarily by the PwCC acquisition.
A review of the company’s debt and equity should also con-
sider other contractual obligations and commitments, which
are disclosed elsewhere in the financial section. These amounts
are summarized in the table below to facilitate a reader’s review.
The company’s total consolidated Stockholders’ equity
decreased $666 million to $22,782 million at December 31,
2002, primarily due to a decline in Accumulated gains and
(losses) not affecting retained earnings that resulted from a
$2,765 million charge, net of a tax benefit of $1,574 million,
to establish a minimum pension liability for certain of the
company’s non-U.S. pension plans. See page 95 for further
information about this accounting. The decline was partially
offset by an increase in common stock primarily due to the
common stock issued or to be issued for a portion of the
PwCC acquisition ($284 million), the funding of the
PPP through the issuance of treasury shares ($1,871 million)
and a reduction in the company’s ongoing stock repurchase
activity. See note n, “Stockholders’ Equity Activity,” on
pages 87 and 88.
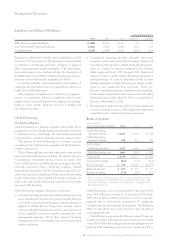
contractual obligations
balance at
payments due in
(dollars in millions) dec. 31, 2002 2003 2004-05 2006-07 after 2007
Long-term debt $«22,723 $«3,949 $«5,283 $«3,551 $«9,940
Lease commitments 6,085 1,370 1,925 1,200 1,590
commitments
balance at
amounts expiring in
(dollars in millions) dec. 31, 2002 2003 2004-05 2006-07 after 2007
Unused lines of credit $÷«3,482 $«3,134 $««««195 $÷÷139 $÷««÷14
Other commitments 288 115 159 14 —
Financial guarantees 126 29 82 1 14
Unused lines of credit represent amounts available to the com-
pany’s distributors to support their working capital needs and
available lines of credit relating to the company’s syndicated
loan activities. Other commitments primarily include the com-
pany’s commitments to provide financing for future purchases
of the company’s products. Financial guarantees represent
guarantees for certain loans and financial commitments the
company had made as of December 31, 2002. See note o,
“Contingencies and Commitments,” on pages 88 and 89.
Liquidity
As discussed on page 50, the company purchased Rational for
approximately $2.1 billion in cash on February 21, 2003. The
company may also decide to make additional contributions to
its pension plans. The decision to fund any of the company’s
plans depends upon economic conditions, employee demo-
graphics, mortality rates and investment performance. The
company estimates that future cash requirements for these
transactions will be funded from cash flow from operations.
See page 83 for a discussion of the company’s lines of credit.
See note y, “Subsequent Events,” on page 104 for information
on the company’s new shelf registration.
Critical Accounting Estimates
The application of GAAP involves the exercise of varying
degrees of judgment. While the resulting accounting estimates
will, by definition, not always precisely equal the related actual
results, seven of these estimates involve more judgment than
others. Two of these estimates are the allowance for uncol-
lectible financing receivables and the fair value of lease residual
values. See page 63 for a discussion of these estimates. The
others are discussed below.
Useful Lives of Technology Group Equipment
The company determines the useful lives and related depre-
ciation charges for plant and equipment in the Technology
Group based on projected product life cycles that could change
significantly due to technical innovations and competitor
actions in response to relatively severe industry cycles. To the
extent actual useful lives are less than previously estimated
lives, the company will increase its depreciation charge or will
write-off or writedown technically obsolete or non-strategic
assets that have been abandoned or sold.