IBM 2002 Annual Report Download - page 48
Download and view the complete annual report
Please find page 48 of the 2002 IBM annual report below. You can navigate through the pages in the report by either clicking on the pages listed below, or by using the keyword search tool below to find specific information within the annual report.-
 1
1 -
2
-
3
-
4
-
5
-
6
-
7
-
8
-
9
-
10
-
11
-
12
-
13
-
14
-
15
-
16
-
17
-
18
-
19
-
20
-
21
-
22
-
23
-
24
-
25
-
26
-
27
-
28
-
29
-
30
-
31
-
32
-
33
-
34
-
35
-
36
-
37
-
 38
38 -
 39
39 -
 40
40 -
 41
41 -
 42
42 -
 43
43 -
 44
44 -
 45
45 -
 46
46 -
 47
47 -
 48
48 -
 49
49 -
 50
50 -
 51
51 -
 52
52 -
 53
53 -
 54
54 -
 55
55 -
 56
56 -
 57
57 -
 58
58 -
59
-
60
-
61
-
62
-
63
-
64
-
65
-
66
-
67
-
68
-
69
-
70
-
71
-
72
-
73
-
74
-
75
-
76
-
77
-
78
-
79
-
80
-
81
-
82
-
83
-
84
-
85
-
86
-
87
-
88
-
89
-
90
-
91
-
92
-
93
-
94
-
95
-
96
-
97
-
98
-
99
-
100
-
101
-
102
-
103
-
104
-
105
-
106
-
107
-
108
-
109
-
110
-
111
-
112
 |
 |

Management Discussion
46 international business machines corporation and Subsidiary Companies
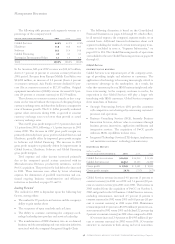
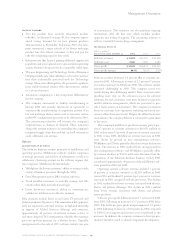
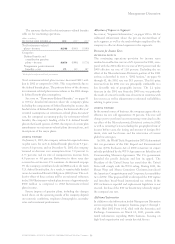
The following table presents each segment’s revenue as a
percentage of the company’s total:
for the year ended december 31: 2002 2001 2000
Global Services 44.8% 42.1% 39.0%
Hardware 33.8 36.8 40.5
Software 16.1 15.6 14.8
Global Financing 4.0 4.1 4.1
Enterprise Investments/Other 1.3 1.4 1.6
Total 100.0% 100.0% 100.0%
In the Americas, full-year 2002 revenue was $36,423 million,
down 2.7 percent (1 percent at constant currency) from the
2001 period. Revenue from Europe/Middle East/Africa was
$24,260 million, an increase of 1.1 percent (down 4 percent
at constant currency). Asia Pacific revenue declined 0.5 per-
cent (flat at constant currency) to $17,153 million. Original
equipment manufacturer (OEM) revenue decreased 24.1 per-
cent (24 percent at constant currency) to $3,350 million.
The reference to constant currency is made so that a seg-
ment can be viewed without the impacts of changing foreign
currency exchange rates and therefore facilitates a comparative
view of business growth. The U.S. dollar generally weakened
against other currencies during 2002, so growth at constant
currency exchange rates was lower than growth at actual
currency exchange rates.
The overall gross profit margin of 37.3 percent decreased
1.1 points from 2001, following a 1.3 point increase in 2001
versus 2000. The decrease in 2002 gross profit margin was
primarily driven by lower gross profit in Global Services and
Hardware, partially offset by improved gross profit margins
in Software and Global Financing. The increase in 2001
gross profit margin was primarily driven by improvement in
Global Services, Hardware, Software and Global Financing
gross profit margins.
Total expense and other income increased primarily
due to the company’s special actions associated with its
Microelectronics Division, productivity initiatives, and the
PwCC acquisition. The provision for bad debts also increased
in 2002. These increases were offset by lower advertising
expense, the elimination of goodwill amortization and con-
tinued ongoing business transformation and efficiency
initiatives as described on pages 50 and 51.
Looking Forward
The outlook for 2003 is dependent upon the following key
factors, among others:
■
The market for IT products and services and the company’s
ability to gain market share
■
The acceptance of open standards such as Linux
■
The ability to continue converting the company’s tech-
nology leadership into product and services leadership
■
The transformation of IBM’s business into an on demand
business and the streamlining and cost reduction initiatives
associated with the company’s Integrated Supply Chain
The following discussion is based on the Consolidated
Financial Statements on pages 64 through 69, which reflect,
in all material respects, the company’s segment results on an
external basis. Additional financial information about each
segment including the results of certain intercompany trans-
actions is included in note x, “Segment Information,” on
pages 100 to 104. The Global Financing results of operations
are included in the new Global Financing section on pages 60
through 63.
Global Services
description of business
Global Services is an important part of the company’s strat-
egy of providing insight and solutions to customers. The
application of technology is becoming increasingly critical to
customers’ advantage in the marketplace. As a result, the
value that customers place on IBM’s business insight and solu-
tions is increasing. As the company continues to evolve, the
expectation is that Global Services will play a larger role
interfacing with IBM’s customers. Global Services comprises
three main lines of business:
■
Strategic Outsourcing Services (SO) provides customers
with competitive cost advantages by outsourcing customers’
processes and operations.
■
Business Consulting Services (BCS), formerly Business
Innovation Services, delivers value to customers through
business process innovation, application enablement and
integration services. The acquisition of PwCC greatly
enhances IBM’s capabilities in these areas.
■
Integrated Technology Services (ITS) designs, implements,
and maintains customers’ technology infrastructures.
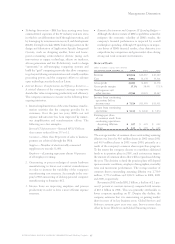
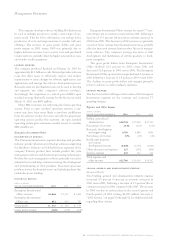
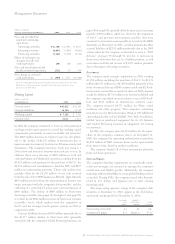
historical results
(dollars in millions)
for the year ended december 31: 2002 2001 2000
Global Services revenue $«36,360 $«34,956 $«33,152
Global Services cost 26,812 25,355 24,309
Gross profit $«««9,548 $«««9,601 $«««8,843
Gross profit margin 26.3% 27.5% 26.7%
Global Services revenue increased 4.0 percent (3 percent at
constant currency) in 2002 over 2001 and 5.4 percent (10 per-
cent at constant currency) in 2001 over 2000. The increase in
2002 resulted from the acquisition of PwCC on October 1,
2002 and growth in the SO business. Global Services revenue,
excluding maintenance, increased 4.5 percent (4 percent at
constant currency) in 2002 versus 2001 and 6.8 percent (11 per-
cent at constant currency) in 2001 versus 2000. Maintenance
revenue improved 1.3 percent to $5,070 million (1 percent at con-
stant currency) in 2002 versus 2001 and declined 2.2 percent (up
2 percent at constant currency) in 2001 when compared to 2000.
SO revenue increased 2.4 percent to $14,995 million (2 per-
cent at constant currency) in 2002 versus 2001. SO remains
attractive to customers in both strong and weak economies.