IBM 2002 Annual Report Download - page 54
Download and view the complete annual report
Please find page 54 of the 2002 IBM annual report below. You can navigate through the pages in the report by either clicking on the pages listed below, or by using the keyword search tool below to find specific information within the annual report.-
 1
1 -
2
-
3
-
4
-
5
-
6
-
7
-
8
-
9
-
10
-
11
-
12
-
13
-
14
-
15
-
16
-
17
-
18
-
19
-
20
-
21
-
22
-
23
-
24
-
25
-
26
-
27
-
28
-
29
-
30
-
31
-
32
-
33
-
34
-
35
-
36
-
37
-
38
-
39
-
40
-
41
-
42
-
43
-
 44
44 -
 45
45 -
 46
46 -
 47
47 -
 48
48 -
 49
49 -
 50
50 -
 51
51 -
 52
52 -
 53
53 -
 54
54 -
 55
55 -
 56
56 -
 57
57 -
 58
58 -
 59
59 -
 60
60 -
 61
61 -
 62
62 -
 63
63 -
 64
64 -
65
-
66
-
67
-
68
-
69
-
70
-
71
-
72
-
73
-
74
-
75
-
76
-
77
-
78
-
79
-
80
-
81
-
82
-
83
-
84
-
85
-
86
-
87
-
88
-
89
-
90
-
91
-
92
-
93
-
94
-
95
-
96
-
97
-
98
-
99
-
100
-
101
-
102
-
103
-
104
-
105
-
106
-
107
-
108
-
109
-
110
-
111
-
112
 |
 |

intellectual property and custom development income
Description
As discussed above, the company’s world-class R&D function
results in superior products for the company’s customers, and
also results in IP income. Some of the technological break-
throughs that IBM achieves are used exclusively in IBM
products while other breakthroughs are used by others when
the new technology is not strategic to IBM’s business goals. A
third group is both used internally and licensed externally.
IP and custom development income comprises the three
categories in the table below. Sales and other transfers of IP
are typically transaction-based lump sums and are relatively
less predictable in amount and timing than licensing/royalty-
based fees. Licensing/royalty-based fees involve ongoing cash
inflow and income streams. The key factors impacting the
amount of income earned in these two categories are the
timing and availability of the company’s licensable IP. IBM
also earns income from performing custom development for
specific customers.
In addition to the IP income sources in the table below,
the company also generates value from its patent portfolio
through cross-licensing arrangements and IP licensed in
divestiture transactions. Cross-licensing arrangements involve
licensing of the company’s IP to a third party in exchange for
the third party’s IP. The company does not record income on
these transactions except to the extent that cash is received.
The value received by IBM for IP transferred in divestiture
transactions is included in the overall gain or loss from the
divestiture and is therefore excluded from the table below.
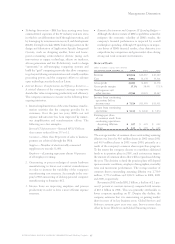
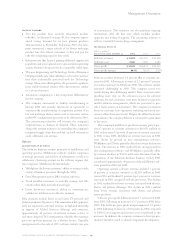
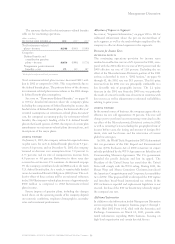
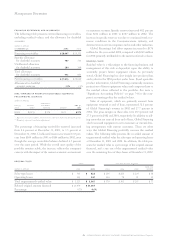
Historical Results
(dollars in millions)
for the year ended december 31: 2002 2001 2000
Sales and other transfers of
intellectual property $«÷«511 $««««727 $««««913
Licensing/royalty-based fees 351 465 528
Custom development income 238 284 223
Total $«1,100 $«1,476 $«1,664
The decreases in sales and other transfers of IP in 2002 versus
2001 and 2001 versus 2000 were primarily due to a greater
number of larger dollar sales and other transfers during the
prior years. The amount of income from licensing/royalty-
based fee transactions has been declining due to economic
conditions and fewer licensing opportunities resulting from
industry consolidation.
Looking Forward
The timing and amount of sales and other transfers of IP may
vary significantly from year to year depending upon the
timing of new patents and know-how development, economic
conditions, and the extent of further industry consolidation,
if any.
other (income)and expense
The primary reason for the reduction in Other (income) and
expense in 2002 was the actions taken by the company in the
second and fourth quarters of 2002 amounting to $513 mil-
lion. See note s, “2002 Actions,” on pages 90 through 92 for
further information. The remaining items of Other (income)
and expense largely offset. These offsetting items include the
lower writedowns of certain equity investments for other
than temporary market declines of $58 million in 2002 as
compared to $405 million in 2001. There were no such write-
downs in 2000. Net realized gains on sales of securities and
other investments were $(63) million in 2002, $(236) million
in 2001 and $(265) million in 2000. These writedowns and
sales activity are related to the dynamics in the equity markets
over the past few years. Additionally, net realized gains from
certain real estate activities were $(66) million in 2002, $(133)
million in 2001 and $(222) million in 2000. The company
recorded interest income (from securities and other invest-
ments excluding the Global Financing business transactions)
of $(127) million in 2002, $(175) million in 2001 and $(308)
million in 2000. Foreign currency transaction gains were
$(39) million, $(190) million and $(128) million in 2002, 2001
and 2000, respectively. The reduction of Other (income) and
expense from 2000 to 2001 was primarily attributable to the
2001 writedown of certain equity investments for other than
temporary market declines.
interest expense
Interest expense is presented in Cost of Global Financing in
the Consolidated Statement of Earnings only if the related
external borrowings are to support the Global Financing
external business. See page 63 for additional information
regarding Global Financing debt and interest expense.
Interest expense, excluding amounts recorded in Cost of
Global Financing, declined 37.9 percent in 2002 from 2001
and 31.4 percent in 2001 versus 2000. The declines were pri-
marily due to lower average interest rates and a decline in
average debt outstanding in the periods.
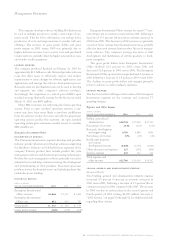
Retirement-Related Benefits
description
The company provides a number of retirement-related ben-
efits to its employees including defined benefit pension plans
and defined contribution pension plans. The company also
provides nonpension postretirement plans comprising retiree
medical and life insurance plans.
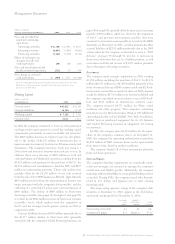
historical results
The following table provides the total pre-tax (income)/cost
for all retirement-related plans. (Income)/cost amounts are
included as a reduction of/addition to, respectively, the
company’s cost and expense amounts in the Consolidated
Statement of Earnings within the caption (e.g., Cost, SG&A,
RD&E) relating to the job function of the individuals partici-
pating in the plans.
Management Discussion
52 international business machines corporation and Subsidiary Companies