IBM 2002 Annual Report Download - page 104
Download and view the complete annual report
Please find page 104 of the 2002 IBM annual report below. You can navigate through the pages in the report by either clicking on the pages listed below, or by using the keyword search tool below to find specific information within the annual report.-
 1
1 -
2
-
3
-
4
-
5
-
6
-
7
-
8
-
9
-
10
-
11
-
12
-
13
-
14
-
15
-
16
-
17
-
18
-
19
-
20
-
21
-
22
-
23
-
24
-
25
-
26
-
27
-
28
-
29
-
30
-
31
-
32
-
33
-
34
-
35
-
36
-
37
-
38
-
39
-
40
-
41
-
42
-
43
-
44
-
45
-
46
-
47
-
48
-
49
-
50
-
51
-
52
-
53
-
54
-
55
-
56
-
57
-
58
-
59
-
60
-
61
-
62
-
63
-
64
-
65
-
66
-
67
-
68
-
69
-
70
-
71
-
72
-
73
-
74
-
75
-
76
-
77
-
78
-
79
-
80
-
81
-
82
-
83
-
84
-
85
-
86
-
87
-
88
-
89
-
90
-
91
-
92
-
93
-
 94
94 -
 95
95 -
 96
96 -
 97
97 -
 98
98 -
 99
99 -
 100
100 -
 101
101 -
 102
102 -
 103
103 -
 104
104 -
 105
105 -
 106
106 -
 107
107 -
 108
108 -
 109
109 -
 110
110 -
 111
111 -
 112
112
 |
 |

Notes to Consolidated Financial Statements
102 international business machines corporation and Subsidiary Companies
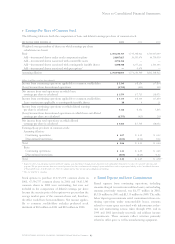
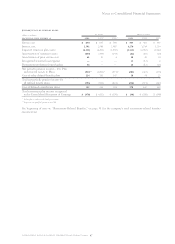
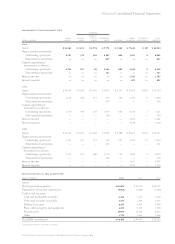
reconciliations to ibm as reported
(dollars in millions) 2002 2001 2000
revenue:
Total reportable segments $«87,986 $«89,996 $«92,015
Other revenue and
adjustments (103) (227) (6)
Elimination of internal
revenue (6,697) (6,702) (6,920)
Total IBM consolidated $«81,186 $«83,067 $«85,089
(dollars in millions) 2002 2001 2000
pre-tax income:
Total reportable segments $«««8,436 $«11,009 $«10,908
Elimination of internal
transactions (164) 108 62
Unallocated corporate
amounts (748) 333 441
Total IBM consolidated $«««7,524 $«11,450 $«11,411
Immaterial Items
investment in equity alliances and
equity alliances gains/(losses)
The investments in equity alliances and the resulting gains
and (losses) from these investments that are attributable to
the segments do not have a material effect on the financial
position or the financial results of the segments.
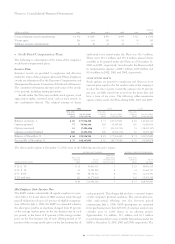
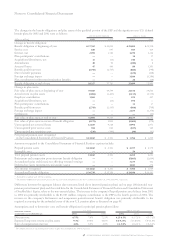
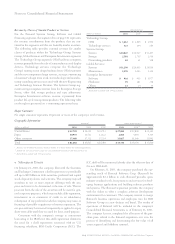
Segment Assets and Other Items
The Global Services assets primarily are accounts receivable,
maintenance inventory, and plant, property and equipment
including those associated with the segment’s outsourcing
business. The assets of the Hardware segments primarily are
inventory and plant, property and equipment. The Software
segment assets mainly are plant, property and equipment, and
investment in capitalized software. The assets of the Global
Financing segment are primarily financing receivables and
fixed assets under operating leases.
To accomplish the efficient use of the company’s space and
equipment, it usually is necessary for several segments to
share plant, property and equipment assets. Where assets are
shared, landlord ownership of the assets is assigned to one
segment and is not allocated to each user segment. This is
consistent with the company’s management system and is
reflected accordingly in the schedule on page 103. In those
cases, there will not be a precise correlation between segment
pre-tax income and segment assets.
Similarly, the depreciation amounts reported by each seg-
ment are based on the assigned landlord ownership and may
not be consistent with the amounts that are included in the
segments’ pre-tax income. The amounts that are included in
pre-tax income reflect occupancy charges from the landlord
segment and are not specifically identified by the management
reporting system. Capital expenditures that are reported by
each segment also are in line with the landlord ownership
basis of asset assignment.
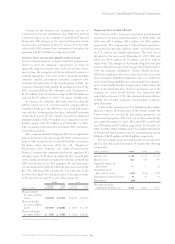
The Global Financing segment amounts on page 103 for
Interest income and Cost of Global Financing interest expense
reflect the interest income and interest expense associated with
the Global Financing business, including the intercompany
financing activities discussed on page 60 as well as the income
from the investment in cash and marketable securities. The
explanation of the difference between Cost of Global Financing
and Interest expense for segment presentation versus presen-
tation in the Consolidated Statement of Earnings is included
on page 63 of the Management Discussion.