IBM 2002 Annual Report Download - page 91
Download and view the complete annual report
Please find page 91 of the 2002 IBM annual report below. You can navigate through the pages in the report by either clicking on the pages listed below, or by using the keyword search tool below to find specific information within the annual report.-
 1
1 -
2
-
3
-
4
-
5
-
6
-
7
-
8
-
9
-
10
-
11
-
12
-
13
-
14
-
15
-
16
-
17
-
18
-
19
-
20
-
21
-
22
-
23
-
24
-
25
-
26
-
27
-
28
-
29
-
30
-
31
-
32
-
33
-
34
-
35
-
36
-
37
-
38
-
39
-
40
-
41
-
42
-
43
-
44
-
45
-
46
-
47
-
48
-
49
-
50
-
51
-
52
-
53
-
54
-
55
-
56
-
57
-
58
-
59
-
60
-
61
-
62
-
63
-
64
-
65
-
66
-
67
-
68
-
69
-
70
-
71
-
72
-
73
-
74
-
75
-
76
-
77
-
78
-
79
-
80
-
 81
81 -
 82
82 -
 83
83 -
 84
84 -
 85
85 -
 86
86 -
 87
87 -
 88
88 -
 89
89 -
 90
90 -
 91
91 -
 92
92 -
 93
93 -
 94
94 -
 95
95 -
 96
96 -
 97
97 -
 98
98 -
 99
99 -
 100
100 -
 101
101 -
102
-
103
-
104
-
105
-
106
-
107
-
108
-
109
-
110
-
111
-
112
 |
 |

Notes to Consolidated Financial Statements
89international business machines corporation and Subsidiary Companies
disclose certain types of guarantees, even if the likelihood of
requiring the guarantor’s performance is remote. The follow-
ing is a description of arrangements in which the company is
the guarantor.
The company is a party to a variety of agreements pursuant
to which it may be obligated to indemnify the other party with
respect to certain matters. Typically, these obligations arise in
the context of contracts entered into by the company, under
which the company customarily agrees to hold the other party
harmless against losses arising from a breach of representations
and covenants related to such matters as title to assets sold,
certain IP rights, specified environmental matters, and certain
income taxes. In each of these circumstances, payment by the
company is conditioned on the other party making a claim
pursuant to the procedures specified in the particular contract,
which procedures typically allow the company to challenge
the other party’s claims. Further, the company’s obligations
under these agreements may be limited in terms of time and/or
amount, and in some instances, the company may have recourse
against third parties for certain payments made by the company.
It is not possible to predict the maximum potential amount
of future payments under these or similar agreements due to the
conditional nature of the company’s obligations and the unique
facts and circumstances involved in each particular agreement.
Historically, payments made by the company under these
agreements did not have a material effect on the company’s
business, financial condition or results of operations. The com-
pany believes that if it were to incur a loss in any of these
matters, such loss should not have a material effect on the
company’s business, financial condition or results of operations.
In addition, the company guarantees certain loans and
financial commitments. The maximum potential future pay-
ment under these financial guarantees was $126 million and
$218 million at December 31, 2002 and 2001, respectively.
These amounts include the limited guarantee associated with
the company’s loans receivable securitization program. See
note j, “Sale and Securitization of Receivables,” on page 82.
The company extended lines of credit, of which the unused
amounts were $3,482 million and $4,088 million at December
31, 2002 and 2001, respectively. A portion of these amounts was
available to the company’s business partners to support their
working capital needs. In addition, the company committed to
provide future financing to its customers in connection with
customer purchase agreements for approximately $288 million
and $269 million at December 31, 2002 and 2001, respectively.
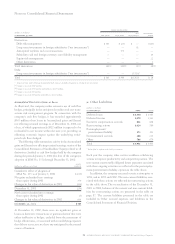
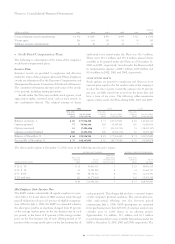
Changes in the company’s warranty liability balance are
illustrated in the following table:
(dollars in millions) 2002 2001
Balance at January 1 $«520 $«572
Current period accruals 863 823
Accrual adjustments to reflect
actual experience 121 (2)
Charges incurred «(890) (873)
Balance at December 31 $«614 $«520
Accrual adjustments in 2002 principally reflect a signifi-
cant increase in the failure rates of HDD components in the
company’s Server and Storage products as a result of prod-
uct transitions.
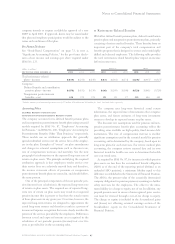
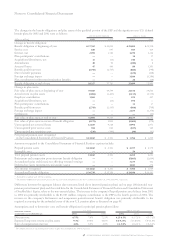
pTaxes
(dollars in millions)
for the year ended december 31: 2002 2001 2000
Income from continuing
operations before
income taxes:
U.S. operations $«3,838 $«««5,644 $«««5,914
Non-U.S. operations 3,686 5,806 5,497
Total income from
continuing operations
before income taxes $«7,524 $«11,450 $«11,411
The continuing operations provision for income taxes by
geographic operations is as follows:
(dollars in millions)
for the year ended december 31: 2002 2001 2000
U.S. operations $««««934 $«««1,543 $«««1,798
Non-U.S. operations 1,256 1,761 1,739
Total continuing operations
provision for income taxes $«2,190 $«««3,304 $«««3,537
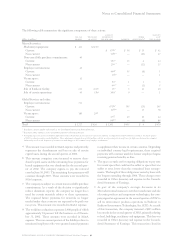
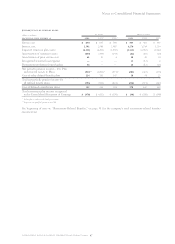
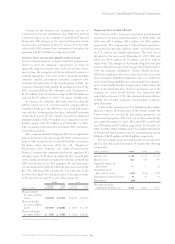
The components of the continuing operations provision for
income taxes by taxing jurisdiction are as follows:
(dollars in millions)
for the year ended december 31: 2002 2001 2000
U.S. federal:
Current $««««287 $««««434 $««««719
Deferred (3) 333 285
284 767 1,004
U.S. state and local:
Current 184 73 192
Deferred 3155 47
187 228 239
Non-U.S.:
Current 1,786 2,133 2,582
Deferred (67) 176 (288)
1,719 2,309 2,294
Total continuing operations
provision for income taxes 2,190 3,304 3,537
Provision for social security,
real estate, personal
property and other taxes 2,789 2,730 2,734
Total continuing operations
provision for taxes $«4,979 $«6,034 $«6,271