IBM 2002 Annual Report Download - page 105
Download and view the complete annual report
Please find page 105 of the 2002 IBM annual report below. You can navigate through the pages in the report by either clicking on the pages listed below, or by using the keyword search tool below to find specific information within the annual report.-
 1
1 -
2
-
3
-
4
-
5
-
6
-
7
-
8
-
9
-
10
-
11
-
12
-
13
-
14
-
15
-
16
-
17
-
18
-
19
-
20
-
21
-
22
-
23
-
24
-
25
-
26
-
27
-
28
-
29
-
30
-
31
-
32
-
33
-
34
-
35
-
36
-
37
-
38
-
39
-
40
-
41
-
42
-
43
-
44
-
45
-
46
-
47
-
48
-
49
-
50
-
51
-
52
-
53
-
54
-
55
-
56
-
57
-
58
-
59
-
60
-
61
-
62
-
63
-
64
-
65
-
66
-
67
-
68
-
69
-
70
-
71
-
72
-
73
-
74
-
75
-
76
-
77
-
78
-
79
-
80
-
81
-
82
-
83
-
84
-
85
-
86
-
87
-
88
-
89
-
90
-
91
-
92
-
93
-
94
-
 95
95 -
 96
96 -
 97
97 -
 98
98 -
 99
99 -
 100
100 -
 101
101 -
 102
102 -
 103
103 -
 104
104 -
 105
105 -
 106
106 -
 107
107 -
 108
108 -
 109
109 -
 110
110 -
 111
111 -
 112
112
 |
 |

Notes to Consolidated Financial Statements
103international business machines corporation and Subsidiary Companies
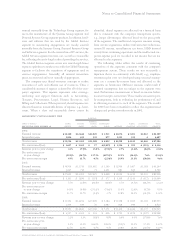
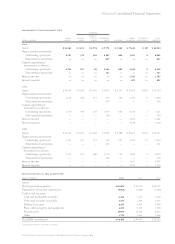
management system segment view
hardware
personal
global systems systems technology global enterprise total
(dollars in millions) services group group group software financing investments segments
2002:
Assets $«14,462 $«3,124 $«1,776 $«5,771 $«3,361 $«35,242 $«««88 $«63,824
Depreciation/amortization:
Continuing operations 1,213 335 116 1,167 809 2,413 8 6,061
Discontinued operations ———617———617
Capital expenditures/
investment in software:
Continuing operations 1,294 307 96 1,365 687 2,561 9 6,319
Discontinued operations ———323———323
Interest income —————2,703—2,703
Interest expense —————825—825
2001:
Assets $«10,340 $«3,208 $«1,904 $«9,136 $«3,356 $«36,670 $«106 $«64,720
Depreciation/amortization:
Continuing operations 1,219 308 131 676 782 2,476 8 5,600
Discontinued operations ———429———429
Capital expenditures/
investment in software:
Continuing operations 1,519 390 128 1,495 839 3,143 7 7,521
Discontinued operations ———360———360
Interest income —————2,941 — 2,941
Interest expense —————1,140 — 1,140
2000:
Assets $«10,492 $«3,451 $«2,448 $«9,316 $«2,488 $«40,822 $«246 $«69,263
Depreciation/amortization:
Continuing operations 1,243 425 154 649 665 2,696 12 5,844
Discontinued operations ———411———411
Capital expenditures/
investment in software:
Continuing operations 1,311 325 180 1,326 770 2,898 9 6,819
Discontinued operations ———418———418
Interest income —————3,051 — 3,051
Interest expense —————1,319 — 1,319
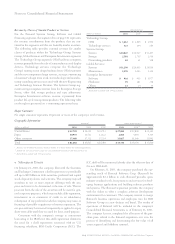
reconciliations to ibm as reported
(dollars in millions) 2002 2001*2000*
Assets:
Total reportable segments $«63,824 $«64,720 $«69,263
Elimination of internal transactions (5,061) (4,884) (5,300)
Unallocated amounts:
Cash and marketable securities 4,568 5,313 2,268
Notes and accounts receivable 3,553 2,810 3,145
Deferred tax assets 6,631 4,624 5,498
Plant, other property and equipment 3,239 3,260 3,798
Pension assets 15,996 11,398 8,872
Other 3,734 3,062 2,868
Total IBM consolidated $«96,484 $«90,303 $«90,412
*Reclassified to conform with 2002 presentation.