IBM 2002 Annual Report Download - page 108
Download and view the complete annual report
Please find page 108 of the 2002 IBM annual report below. You can navigate through the pages in the report by either clicking on the pages listed below, or by using the keyword search tool below to find specific information within the annual report.-
 1
1 -
2
-
3
-
4
-
5
-
6
-
7
-
8
-
9
-
10
-
11
-
12
-
13
-
14
-
15
-
16
-
17
-
18
-
19
-
20
-
21
-
22
-
23
-
24
-
25
-
26
-
27
-
28
-
29
-
30
-
31
-
32
-
33
-
34
-
35
-
36
-
37
-
38
-
39
-
40
-
41
-
42
-
43
-
44
-
45
-
46
-
47
-
48
-
49
-
50
-
51
-
52
-
53
-
54
-
55
-
56
-
57
-
58
-
59
-
60
-
61
-
62
-
63
-
64
-
65
-
66
-
67
-
68
-
69
-
70
-
71
-
72
-
73
-
74
-
75
-
76
-
77
-
78
-
79
-
80
-
81
-
82
-
83
-
84
-
85
-
86
-
87
-
88
-
89
-
90
-
91
-
92
-
93
-
94
-
95
-
96
-
97
-
 98
98 -
 99
99 -
 100
100 -
 101
101 -
 102
102 -
 103
103 -
 104
104 -
 105
105 -
 106
106 -
 107
107 -
 108
108 -
 109
109 -
 110
110 -
 111
111 -
 112
112
 |
 |

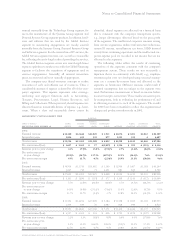
106 international business machines corporation and Subsidiary Companies
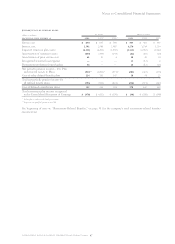
Selected Quarterly Data
(dollars in millions except per share amounts and stock prices)
first second third fourth full
2002: quarter quarter quarter quarter year
Revenue $«18,030 $«19,651 $«19,821 $«23,684 $«81,186
Gross profit 6,500 7,270 7,323 9,191 30,284
Income from continuing operations 1,284 445*1,694 1,911*5,334
Loss from discontinued operations (92) (389) (381) (893) (1,755)
Net income 1,192 56 1,313 1,018 3,579
Earnings/(loss) per share of common stock:
Assuming dilution:
Continuing operations 0.73 0.25 0.99 1.11 3.07**
Discontinued operations (0.05) (0.22) (0.22) (0.52) (1.01)
Total 0.68 0.03 0.76+0.59 2.06
Basic:
Continuing operations 0.75 0.26 1.00 1.12 3.13
Discontinued operations (0.05) (0.23) (0.23) (0.53) (1.03) **
Total 0.69+0.03 0.78+0.60+2.10
Dividends per share of common stock 0.14 0.15 0.15 0.15 0.59
Stock prices:++
High $«126.39 $«104.00 $«««82.85 $«««89.46
Low 95.76 66.10 57.99 54.01
first second third fourth full
2001: quarter quarter quarter quarter year
Revenue $«20,309 $«20,834 $«19,783 $«22,141 $«83,067
Gross profit 7,535 7,987 7,434 8,933 31,889
Income from continuing operations 1,777 2,091 1,713 2,565 8,146
Loss from discontinued operations (27) (46) (118) (232) (423)
Net income 1,750 2,045 1,595 2,333 7,723
Earnings/(loss) per share of common stock:
Assuming dilution:
Continuing operations 1.00 1.17 0.97 1.46 4.59**
Discontinued operations (0.02) (0.03) (0.07) (0.13) (0.24) **
Total 0.98 1.15+0.90 1.33 4.35**
Basic:
Continuing operations 1.02 1.20 0.99 1.49 4.69**
Discontinued operations (0.02) (0.03) (0.07) (0.14) (0.24) **
Total 1.00 1.17 0.92 1.35 4.45**
Dividends per share of common stock 0.13 0.14 0.14 0.14 0.55
Stock prices:++
High $«118.64 $«119.90 $«115.40 $«124.70
Low 83.75 90.05 87.49 91.34
*The company executed special actions in the second and fourth quarter of 2002 recording charges of $1,727 million and $322 million, respectively. See note S,
“2002 Actions” on pages 90 through 92 for additional information regarding these actions.
** Earnings Per Share (EPS) in each quarter is computed using the weighted-average number of shares outstanding during that quarter while EPS for the full year
is computed using the weighted-average number of shares outstanding during the year. Thus, the sum of the four quarters’ EPS does not equal the full-year EPS.
+Does not total due to rounding.
++ The stock prices reflect the high and low prices for IBM’s common stock on the New York Stock Exchange composite tape for the last two years.