IBM 2002 Annual Report Download - page 92
Download and view the complete annual report
Please find page 92 of the 2002 IBM annual report below. You can navigate through the pages in the report by either clicking on the pages listed below, or by using the keyword search tool below to find specific information within the annual report.-
 1
1 -
2
-
3
-
4
-
5
-
6
-
7
-
8
-
9
-
10
-
11
-
12
-
13
-
14
-
15
-
16
-
17
-
18
-
19
-
20
-
21
-
22
-
23
-
24
-
25
-
26
-
27
-
28
-
29
-
30
-
31
-
32
-
33
-
34
-
35
-
36
-
37
-
38
-
39
-
40
-
41
-
42
-
43
-
44
-
45
-
46
-
47
-
48
-
49
-
50
-
51
-
52
-
53
-
54
-
55
-
56
-
57
-
58
-
59
-
60
-
61
-
62
-
63
-
64
-
65
-
66
-
67
-
68
-
69
-
70
-
71
-
72
-
73
-
74
-
75
-
76
-
77
-
78
-
79
-
80
-
81
-
 82
82 -
 83
83 -
 84
84 -
 85
85 -
 86
86 -
 87
87 -
 88
88 -
 89
89 -
 90
90 -
 91
91 -
 92
92 -
 93
93 -
 94
94 -
 95
95 -
 96
96 -
 97
97 -
 98
98 -
 99
99 -
 100
100 -
 101
101 -
 102
102 -
103
-
104
-
105
-
106
-
107
-
108
-
109
-
110
-
111
-
112
 |
 |

Notes to Consolidated Financial Statements
90 international business machines corporation and Subsidiary Companies
The effect of tax law changes on deferred tax assets and
liabilities did not have a significant effect on the company’s
effective tax rate.
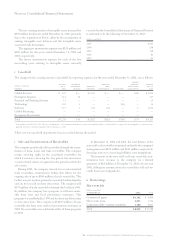
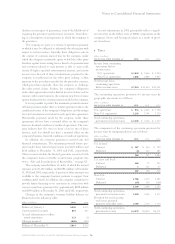
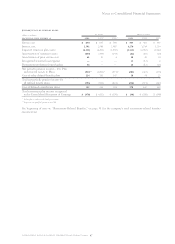
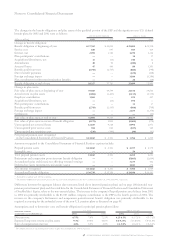
The significant components of activities that gave rise to
deferred tax assets and liabilities that are recorded in the
Consolidated Statement of Financial Position were as follows:
deferred tax assets
(dollars in millions)
at december 31: 2002 2001*
Retirement benefits $«««3,587 $«««2,589
Capitalized research and development 2,251 747
Alternative minimum tax credits 1,316 1,282
Employee benefits 1,049 1,122
Deferred income 895 694
Bad debt, inventory and
warranty reserves 850 863
General business credits 798 700
Infrastructure reduction charges 560 465
Depreciation 441 386
Foreign tax loss carryforwards 304 325
State and local tax loss carryforwards 239 238
Other 2,266 1,781
Gross deferred tax assets 14,556 11,192
Less: Valuation allowance 628 581
Net deferred tax assets $«13,928 $«10,611
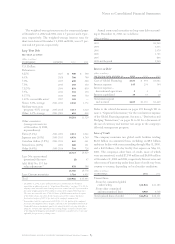
deferred tax liabilities
(dollars in millions)
at december 31: 2002 2001*
Retirement benefits $«««5,904 $«««3,829
Sales-type leases 1,088 1,814
Depreciation 329 425
Other 1,431 1,475
Gross deferred tax liabilities $«««8,752 $«««7,543
*Reclassified to conform with 2002 presentation.
The valuation allowance at December 31, 2002, principally
applies to certain state and local, and foreign tax loss carry-
forwards that, in the opinion of management, are more likely
than not to expire before the company can use them.
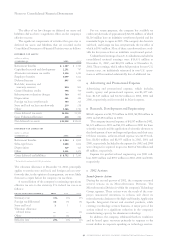
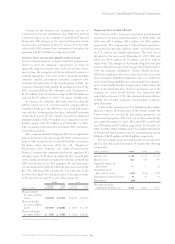
A reconciliation of the company’s continuing operations
effective tax rate to the statutory U.S. federal tax rate is as
follows:
for the year ended december 31: 2002 2001 2000
Statutory rate 35% 35% 35%
Foreign tax differential (7) (6) (6)
State and local 111
Valuation allowance
related items ——(1)
Other —(1) 2
Effective rate 29% 29% 31%
For tax return purposes, the company has available tax
credit carryforwards of approximately $2,234 million, of which
$1,316 million have an indefinite carryforward period and the
remainder begin to expire in 2005. The company also has state
and local, and foreign tax loss carryforwards, the tax effect of
which is $543 million. Most of these carryforwards are avail-
able for five years or have an indefinite carryforward period.
Undistributed earnings of non-U.S. subsidiaries included in
consolidated retained earnings were $16,631 million at
December 31, 2002, and $16,851 million at December 31,
2001. These earnings, which reflect full provision for non-U.S.
income taxes, are indefinitely reinvested in non-U.S. opera-
tions or will be remitted substantially free of additional tax.
qAdvertising and Promotional Expense
Advertising and promotional expense, which includes
media, agency and promotional expense, was $1,427 mil-
lion, $1,615 million and $1,742 million in 2002, 2001 and
2000, respectively, and is recorded in SG&A expense.
rResearch, Development and Engineering
RD&E expense was $4,750 million in 2002, $4,986 million in
2001 and $5,084 million in 2000.
The company incurred expense of $4,247 million in 2002,
$4,321 million in 2001 and $4,301 million in 2000 for basic
scientific research and the application of scientific advances to
the development of new and improved products and their uses.
Of these amounts, software-related expense was $1,974 mil-
lion, $1,926 million and $1,955 million in 2002, 2001 and
2000, respectively. Included in the expense for 2002 and 2000
were charges for acquired in-process R&D of $4 million and
$9 million, respectively.
Expense for product-related engineering was $503 mil-
lion, $665 million and $783 million in 2002, 2001 and 2000,
respectively.
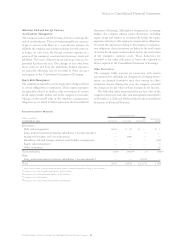
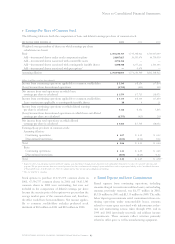
s2002 Actions
Second Quarter Actions
During the second quarter of 2002, the company executed
several actions in its Microelectronics Division. The
Microelectronics Division is within the company’s Technology
Group segment. These actions were the result of the com-
pany’s announced intentions to refocus and direct its
microelectronics business to the high-end foundry, Application
Specific Integrated Circuit and standard products, while
creating a technology services business. A major part of the
actions related to a significant reduction in the company’s
manufacturing capacity for aluminum technology.
In addition, the company rebalanced both its workforce
and its leased space resources primarily in response to the
recent decline in corporate spending on technology services.