IBM 2002 Annual Report Download - page 66
Download and view the complete annual report
Please find page 66 of the 2002 IBM annual report below. You can navigate through the pages in the report by either clicking on the pages listed below, or by using the keyword search tool below to find specific information within the annual report.-
 1
1 -
2
-
3
-
4
-
5
-
6
-
7
-
8
-
9
-
10
-
11
-
12
-
13
-
14
-
15
-
16
-
17
-
18
-
19
-
20
-
21
-
22
-
23
-
24
-
25
-
26
-
27
-
28
-
29
-
30
-
31
-
32
-
33
-
34
-
35
-
36
-
37
-
38
-
39
-
40
-
41
-
42
-
43
-
44
-
45
-
46
-
47
-
48
-
49
-
50
-
51
-
52
-
53
-
54
-
55
-
 56
56 -
 57
57 -
 58
58 -
 59
59 -
 60
60 -
 61
61 -
 62
62 -
 63
63 -
 64
64 -
 65
65 -
 66
66 -
 67
67 -
 68
68 -
 69
69 -
 70
70 -
 71
71 -
 72
72 -
 73
73 -
 74
74 -
 75
75 -
 76
76 -
77
-
78
-
79
-
80
-
81
-
82
-
83
-
84
-
85
-
86
-
87
-
88
-
89
-
90
-
91
-
92
-
93
-
94
-
95
-
96
-
97
-
98
-
99
-
100
-
101
-
102
-
103
-
104
-
105
-
106
-
107
-
108
-
109
-
110
-
111
-
112
 |
 |

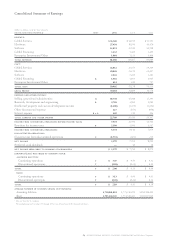
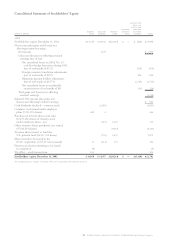
Consolidated Statement of Earnings
64 international business machines corporation and Subsidiary Companies
(dollars in millions except per share amounts)
for the year ended december 31: notes 2002 2001 2000
revenue:
Global Services $«36,360 $«34,956 $«33,152
Hardware 27,456 30,593 34,470
Software 13,074 12,939 12,598
Global Financing 3,232 3,426 3,465
Enterprise Investments/Other 1,064 1,153 1,404
total revenue 81,186 83,067 85,089
cost:
Global Services 26,812 25,355 24,309
Hardware 20,020 21,231 24,207
Software 2,043 2,265 2,283
Global Financing k1,416 1,693 1,965
Enterprise Investments/Other 611 634 747
total cost 50,902 51,178 53,511
gross profit 30,284 31,889 31,578
expense and other income:
Selling, general and administrative q18,738 17,048 17,393
Research, development and engineering r4,750 4,986 5,084
Intellectual property and custom development income (1,100) (1,476) (1,664)
Other (income) and expense 227 (353) (990)
Interest expense k &l145 234 344
total expense and other income 22,760 20,439 20,167
income from continuing operations before income taxes 7,524 11,450 11,411
Provision for income taxes p2,190 3,304 3,537
income from continuing operations 5,334 8,146 7,874
discontinued operations:
(Loss)/income from discontinued operations c(1,755) (423) 219
net income 3,579 7,723 8,093
Preferred stock dividends —10 20
net income applicable to common stockholders $«««3,579 $«««7,713 $÷«8,073
earnings/(loss)per share of common stock:
assuming dilution:
Continuing operations t$«««««3.07 $««÷«4.59 $«÷««4.32
Discontinued operations t««««(1.01) «÷««(0.24) «÷««0.12
total t$«««««2.06 $«÷««4.35 $«÷««4.44
basic:
Continuing operations t$«««««3.13 $««÷«4.69 $«÷««4.45
Discontinued operations t««««(1.03) «÷««(0.24) «÷««0.12
total t$«««««2.10 $«÷««4.45 $«÷««4.58*
average number of common shares outstanding:
Assuming dilution 1,730,941,054 ««÷«1,771,230,599 «÷««1,812,118,422
Basic «1,703,244,345 «÷««1,733,348,422 «÷««1,763,037,049
*Does not total due to rounding.
The accompanying notes on pages 70 through 104 are an integral part of the financial statements.