IBM 2002 Annual Report Download - page 103
Download and view the complete annual report
Please find page 103 of the 2002 IBM annual report below. You can navigate through the pages in the report by either clicking on the pages listed below, or by using the keyword search tool below to find specific information within the annual report.-
 1
1 -
2
-
3
-
4
-
5
-
6
-
7
-
8
-
9
-
10
-
11
-
12
-
13
-
14
-
15
-
16
-
17
-
18
-
19
-
20
-
21
-
22
-
23
-
24
-
25
-
26
-
27
-
28
-
29
-
30
-
31
-
32
-
33
-
34
-
35
-
36
-
37
-
38
-
39
-
40
-
41
-
42
-
43
-
44
-
45
-
46
-
47
-
48
-
49
-
50
-
51
-
52
-
53
-
54
-
55
-
56
-
57
-
58
-
59
-
60
-
61
-
62
-
63
-
64
-
65
-
66
-
67
-
68
-
69
-
70
-
71
-
72
-
73
-
74
-
75
-
76
-
77
-
78
-
79
-
80
-
81
-
82
-
83
-
84
-
85
-
86
-
87
-
88
-
89
-
90
-
91
-
92
-
 93
93 -
 94
94 -
 95
95 -
 96
96 -
 97
97 -
 98
98 -
 99
99 -
 100
100 -
 101
101 -
 102
102 -
 103
103 -
 104
104 -
 105
105 -
 106
106 -
 107
107 -
 108
108 -
 109
109 -
 110
110 -
 111
111 -
 112
112
 |
 |

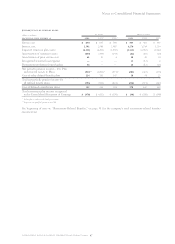
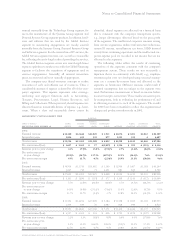
management system segment view
hardware
personal
(dollars in millions) global systems systems technology global enterprise total
for the year ended december 31: services group group group software financing investments segments
2002:
External revenue $«36,360 $«12,646 $«11,049 $««3,935 $«13,074 $«3,203 $«1,022 $«81,289
Internal revenue 2,854 659 139 877 1,225 939 4 6,697
Total revenue $«39,214 $«13,305 $«11,188 $««4,812 $«14,299 $«4,142 $«1,026 $«87,986
Pre-tax income/(loss) $«««3,657 $÷«1,561 $««««««««57 $«(1,057) $«««3,556 $««««955 $«««(293) $«««8,436
Revenue year-to-year change 4.3% (7.9) % (7.2) % (27.1) % 2.7% (2.4) % (8.6) % (2.2) %
Pre-tax income year-
to-year change (29.1) % (14.7) % 137.3% (697.2) % 12.2% (16.4) % 7.6% (23.4) %
Pre-tax income margin 9.3% 11.7% 0.5% (22.0) % 24.9% 23.1% (28.6) % 9.6%
2001:
External revenue $«34,956 $«13,743 $«11,982 $««5,149 $«12,939 $«3,407 $«1,118 $«83,294
Internal revenue 2,647 710 73 1,451 981 836 4 6,702
Total revenue $«37,603 $«14,453 $«12,055 $««6,600 $«13,920 $«4,243 $«1,122 $«89,996
Pre-tax income/(loss) $«««5,161 $÷«1,830 $«««««(153) $«««««177 $«««3,168 $«1,143 $«««(317) $«11,009
Revenue year-to-year change 5.7% (2.6) % (20.5) % (8.0) % 3.7% (4.5) % (18.2) % (2.2) %
Pre-tax income year-
to-year change 14.3% (4.8) % (251.5) % (74.6) % 13.4% (2.8) % (6.7) % 0.9%
Pre-tax income margin 13.7% 12.7% (1.3) % 2.7% 22.8% 26.9% (28.3) % 12.2%
2000:
External revenue $«33,152 $«14,194 $«15,098 $««5,184 $«12,598 $«3,500 $«1,369 $«85,095
Internal revenue 2,439 649 70 1,987 828 944 3 6,920
Total revenue $«35,591 $«14,843 $«15,168 $««7,171 $«13,426 $«4,444 $«1,372 $«92,015
Pre-tax income/(loss) $«««4,517 $÷«1,922 $««««««101 $«««««696 $«««2,793 $«1,176 $«««(297) $«10,908
Revenue year-to-year change 2.2% 3.1% (3.0) % 8.9% 0.0% 9.6% (17.8) % 1.6%
Pre-tax income year-
to-year change 1.2% 21.3% 304.0% 205.3% (9.9) % 12.3% 57.4% 11.9%
Pre-tax income margin 12.7% 12.9% 0.7% 9.7% 20.8% 26.5% (21.6) % 11.9%
Notes to Consolidated Financial Statements
101international business machines corporation and Subsidiary Companies
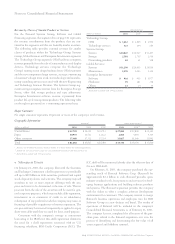
sourced internally from the Technology Group segment for
use in the manufacture of the Systems Group segment and
Personal Systems Group segment products. In addition, hard-
ware and software that are used by the Global Services
segment in outsourcing engagements are mostly sourced
internally from the Systems Group, Personal Systems Group
and Software segments. For the internal use of IT services, the
Global Services segment recovers cost, as well as a reasonable
fee, reflecting the arm’s-length value of providing the services.
The Global Services segment enters into arm’s-length leases
at prices equivalent to market rates with the Global Financing
segment to facilitate the acquisition of equipment used in
services engagements. Generally, all internal transaction
prices are reviewed and reset annually if appropriate.
The company uses shared-resources concepts to realize
economies of scale and efficient use of resources. Thus, a
considerable amount of expense is shared by all of the com-
pany’s segments. This expense represents sales coverage,
marketing and support functions such as Accounting,
Tr easury, Procurement, Legal, Human Resources, and
Billing and Collections. Where practical, shared expenses are
allocated based on measurable drivers of expense, e.g., head-
count. When a clear and measurable driver cannot be
identified, shared expenses are allocated on a financial basis
that is consistent with the company’s management system;
e.g., image advertising is allocated based on the gross profit
of the segments. The unallocated corporate amounts arising
from certain acquisitions, indirect infrastructure reductions,
certain IP income, miscellaneous tax items, HDD internal
activity from continuing operations and the unallocated cor-
porate expense pool are recorded in net income but are not
allocated to the segments.
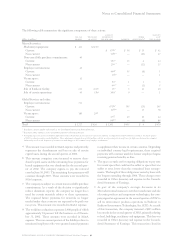
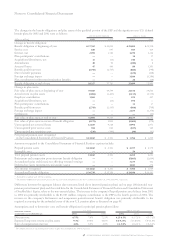
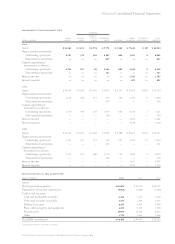
The following tables reflect the results of continuing
operations of the segments consistent with the company’s
management system. These results are not necessarily a
depiction that is in conformity with GAAP; e.g., employee
retirement plan costs are developed using actuarial assump-
tions on a country-by-country basis and allocated to the
segments on headcount. Different amounts could result if
actuarial assumptions that are unique to the segment were
used. Performance measurement is based on income before
income taxes (pre-tax income). These results are used, in part,
by management, both in evaluating the performance of, and
in allocating resources to, each of the segments. The results
for 2000 have been reclassified to reflect the organizational
changes and product transfers made in 2001.