IBM 2002 Annual Report Download - page 64
Download and view the complete annual report
Please find page 64 of the 2002 IBM annual report below. You can navigate through the pages in the report by either clicking on the pages listed below, or by using the keyword search tool below to find specific information within the annual report.-
 1
1 -
2
-
3
-
4
-
5
-
6
-
7
-
8
-
9
-
10
-
11
-
12
-
13
-
14
-
15
-
16
-
17
-
18
-
19
-
20
-
21
-
22
-
23
-
24
-
25
-
26
-
27
-
28
-
29
-
30
-
31
-
32
-
33
-
34
-
35
-
36
-
37
-
38
-
39
-
40
-
41
-
42
-
43
-
44
-
45
-
46
-
47
-
48
-
49
-
50
-
51
-
52
-
53
-
 54
54 -
 55
55 -
 56
56 -
 57
57 -
 58
58 -
 59
59 -
 60
60 -
 61
61 -
 62
62 -
 63
63 -
 64
64 -
 65
65 -
 66
66 -
 67
67 -
 68
68 -
 69
69 -
 70
70 -
 71
71 -
 72
72 -
 73
73 -
 74
74 -
75
-
76
-
77
-
78
-
79
-
80
-
81
-
82
-
83
-
84
-
85
-
86
-
87
-
88
-
89
-
90
-
91
-
92
-
93
-
94
-
95
-
96
-
97
-
98
-
99
-
100
-
101
-
102
-
103
-
104
-
105
-
106
-
107
-
108
-
109
-
110
-
111
-
112
 |
 |

Management Discussion
62 international business machines corporation and Subsidiary Companies
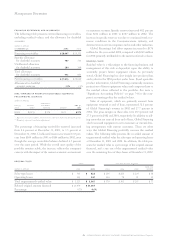
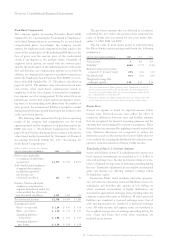
financing receivables and allowances
The following table presents external financing receivables,
excluding residual values, and the allowance for doubtful
accounts.
(dollars in millions)
at december 31: 2002 2001
Financing receivables $«28,007 $«29,331
Specific allowance
for doubtful accounts 787 531
Unallocated allowance
for doubtful accounts 184 160
Total allowance
for doubtful accounts 971 691
Net financing receivables $«27,036 $«28,640
Allowance for doubtful
account coverage 3.5% 2.4%
roll-forward of financing receivables allowance
for doubtful accounts
(dollars in millions)
additions:
dec. 31, reserve bad debts dec. 31,
2001 used*expense other** 2002
$«691 $«(321) $«576 $«25 $«971
*Represents reserved receivables, net of recoveries, that were disposed of during the period.
** Primarily represents translation adjustments.
The percentage of financing receivables reserved increased
from 2.4 percent at December 31, 2001, to 3.5 percent at
December 31, 2002. Unallocated reserves increased 15.0 per-
cent from $160 million in 2001 to $184 million in 2002, even
though the average receivables balance declined 4.5 percent
over the same period. While the overall asset quality of the
portfolio remains stable, the increase reflects the company’s
concern with the impact of the current economic environment
on customer accounts. Specific reserves increased 48.2 percent
from $531 million in 2001 to $787 million in 2002. The
increase in specific reserves was due to continued weak eco-
nomic conditions in the Communications industry, and
deterioration in certain companies in this and other industries.
Global Financing’s bad debts expense increased to $576
million for the year ended 2002, compared with $349 million
for 2001 primarily attributable to the matters referred to above.
residual value
Residual value is a risk unique to the financing business and
management of this risk is dependent upon the ability to
accurately project future equipment values. As previously
stated, Global Financing has clear insight into product plans
and cycles for the IBM product under lease. Based upon this
product information, Global Financing continually monitors
projections of future equipment values and compares them to
the residual values reflected in the portfolio. See note a,
“Significant Accounting Policies” on page 74 for the com-
pany’s accounting policy for residual values.
Sales of equipment, which are primarily sourced from
equipment returned at end of lease, represented 32.1 percent
of Global Financing’s revenue in 2002 and 27.7 percent in
2001. The gross margin on these sales were 28.5 percent and
27.5 percent in 2002 and 2001, respectively. In addition to sell-
ing assets that are sourced from end of lease, Global Financing
also leases used equipment to new customers or extends leas-
ing arrangements with current customers. These are other
ways that Global Financing profitably recovers the residual
values. The following table presents the recorded amount of
unguaranteed residual value for sales-type and operating leases
at December 31, 2001 and 2002. In addition, the table pre-
sents the residual value as a percentage of the original amount
financed, and a run out of the unguaranteed residual value
over the remaining lives of these leases at December 31, 2002.
residual value
total run out of 2002 balance
2006 and
(dollars in millions) 2001 2002 2003 2004 2005 beyond
Sales-type leases $««««««791 $÷÷««821 $«256 $«283 $«224 $«58
Operating leases 334 242 114 78 31 19
Total unguaranteed residual value $«««1,125 $«««1,063 $«370 $«361 $«255 $«77
Related original amount financed $«23,979 $«23,019
Percentage 4.7% 4.6%