IBM 2002 Annual Report Download - page 74
Download and view the complete annual report
Please find page 74 of the 2002 IBM annual report below. You can navigate through the pages in the report by either clicking on the pages listed below, or by using the keyword search tool below to find specific information within the annual report.-
 1
1 -
2
-
3
-
4
-
5
-
6
-
7
-
8
-
9
-
10
-
11
-
12
-
13
-
14
-
15
-
16
-
17
-
18
-
19
-
20
-
21
-
22
-
23
-
24
-
25
-
26
-
27
-
28
-
29
-
30
-
31
-
32
-
33
-
34
-
35
-
36
-
37
-
38
-
39
-
40
-
41
-
42
-
43
-
44
-
45
-
46
-
47
-
48
-
49
-
50
-
51
-
52
-
53
-
54
-
55
-
56
-
57
-
58
-
59
-
60
-
61
-
62
-
63
-
 64
64 -
 65
65 -
 66
66 -
 67
67 -
 68
68 -
 69
69 -
 70
70 -
 71
71 -
 72
72 -
 73
73 -
 74
74 -
 75
75 -
 76
76 -
 77
77 -
 78
78 -
 79
79 -
 80
80 -
 81
81 -
 82
82 -
 83
83 -
 84
84 -
85
-
86
-
87
-
88
-
89
-
90
-
91
-
92
-
93
-
94
-
95
-
96
-
97
-
98
-
99
-
100
-
101
-
102
-
103
-
104
-
105
-
106
-
107
-
108
-
109
-
110
-
111
-
112
 |
 |

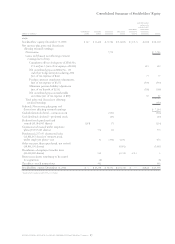
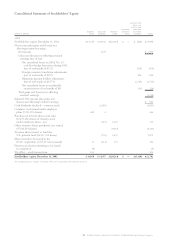
Notes to Consolidated Financial Statements
72 international business machines corporation and Subsidiary Companies
Stock-Based Compensation
The company applies Accounting Principles Board (APB)
Opinion No. 25, “Accounting for Stock Issued to Employees,”
and related Interpretations in accounting for its stock-based
compensation plans. Accordingly, the company records
expense for employee stock compensation plans equal to the
excess of the market price of the underlying IBM shares at the
date of grant over the exercise price of the stock-related
award, if any (known as the intrinsic value). Generally, all
employee stock options are issued with the exercise price
equal to the market price of the underlying shares at the grant
date and therefore, no compensation expense is recorded. In
addition, no compensation expense is recorded for purchases
under the Employees Stock Purchase Plan (ESPP) in accor-
dance with APB Opinion No. 25. This plan is described on
pages 94 and 95. The intrinsic value of restricted stock units
and certain other stock-based compensation issued to
employees as of the date of grant is amortized to compensa-
tion expense over the vesting period. To the extent there are
performance criteria that could result in an employee receiv-
ing more or less (including zero) shares than the number of
units granted, the unamortized liability is marked to market
during the performance period based upon the intrinsic value
at the end of each quarter.
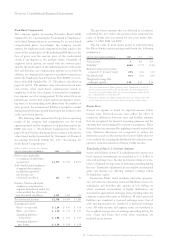
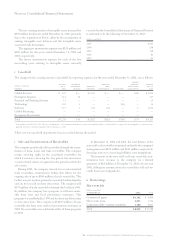
The following table summarizes the pro forma operating
results of the company had compensation cost for stock
options granted and for employee stock purchases under the
ESPP (see note v, “Stock-Based Compensation Plans” on
pages 94 and 95) been determined in accordance with the fair
value based method prescribed by Statement of Financial
Accounting Standards (SFAS)No. 123, “Accounting for
Stock-Based Compensation.”
(dollars in millions except per share amounts)
for the year ended december 31: 2002 2001 2000
Net income applicable
to common stockholders,
as reported $«3,579 $«7,713 $«8,073
Add: Stock-based employee
compensation expense
included in reported
net income, net
of related tax effects «112 «104 «82
Deduct: Total stock-based
employee compensation
expense determined under fair
value method for all awards,
net of related tax effects «1,315 «1,343 «972
Pro forma net income $«2,376 $«6,474 $«7,183
Earnings per share:
Basic
—
as reported $«««2.10 $÷«4.45 $«««4.58
Basic
—
pro forma $«««1.40 $÷«3.74 $÷«4.07
Assuming dilution
—
as reported $«««2.06 $÷«4.35 $«««4.44
Assuming dilution
—
pro forma $«««1.39 $÷«3.69 $÷«3.99
The pro forma amounts that are disclosed in accordance
with SFAS No. 123 reflect the portion of the estimated fair
value of awards that was earned for the years ended Dec-
ember 31, 2002, 2001 and 2000.
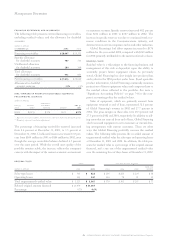
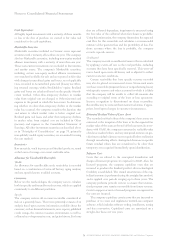
The fair value of stock option grants is estimated using
the Black-Scholes option-pricing model with the following
assumptions:
for the year ended december 31: 2002 2001 2000
Te rm (years)*54/54/5
Volatility** 40.4% 37.7% «32.0%
Risk-free interest rate (zero
coupon U.S. treasury note) 2.8% 4.4% 5.1%
Dividend yield 0.7% 0.5% 0.5%
Weighted-average fair
value per option $«28 $«42 $«36
*There were no tax incentive options granted in 2002. Option term is 5 years for
non-tax incentive options for the year ended December 31, 2002. Option term is
4 years for tax incentive options and 5 years for non-tax incentive options for the
years ended December 31, 2001 and 2000.
** To determine volatility, the company measured the daily price changes of the stock
over the respective term for tax incentive options and non-tax incentive options.
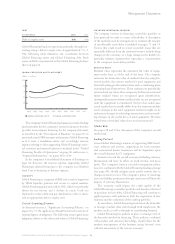
Income Taxes
Income tax expense is based on reported income before
income taxes. Deferred income taxes reflect the effect of
temporary differences between asset and liability amounts
that are recognized for financial reporting purposes and the
amounts that are recognized for income tax purposes. These
deferred taxes are measured by applying currently enacted tax
laws. Valuation allowances are recognized to reduce the
deferred tax assets to the amount that is more likely than not
to be realized. In assessing the likelihood of realization, man-
agement considers estimates of future taxable income.
Translation of Non-U.S. Currency Amounts
Assets and liabilities of non-U.S. subsidiaries that operate in a
local currency environment are translated to U.S. dollars at
year-end exchange rates. Income and expense items are trans-
lated at weighted-average rates of exchange prevailing during
the year. Translation adjustments are recorded in Accumulated
gains and (losses) not affecting retained earnings within
Stockholders’ equity.
Inventories, Plant, rental machines and other property-
net, and other non-monetary assets and liabilities of non-U.S.
subsidiaries and branches that operate in U.S. dollars, or
whose economic environment is highly inflationary, are
translated at approximate exchange rates prevailing when the
company acquired the assets or liabilities. All other assets and
liabilities are translated at year-end exchange rates. Cost of
sales and depreciation are translated at historical exchange
rates. All other income and expense items are translated at
the weighted-average rates of exchange prevailing during the
year. Gains and losses that result from translation are
included in net income.