IBM 2002 Annual Report Download - page 95
Download and view the complete annual report
Please find page 95 of the 2002 IBM annual report below. You can navigate through the pages in the report by either clicking on the pages listed below, or by using the keyword search tool below to find specific information within the annual report.-
 1
1 -
2
-
3
-
4
-
5
-
6
-
7
-
8
-
9
-
10
-
11
-
12
-
13
-
14
-
15
-
16
-
17
-
18
-
19
-
20
-
21
-
22
-
23
-
24
-
25
-
26
-
27
-
28
-
29
-
30
-
31
-
32
-
33
-
34
-
35
-
36
-
37
-
38
-
39
-
40
-
41
-
42
-
43
-
44
-
45
-
46
-
47
-
48
-
49
-
50
-
51
-
52
-
53
-
54
-
55
-
56
-
57
-
58
-
59
-
60
-
61
-
62
-
63
-
64
-
65
-
66
-
67
-
68
-
69
-
70
-
71
-
72
-
73
-
74
-
75
-
76
-
77
-
78
-
79
-
80
-
81
-
82
-
83
-
84
-
 85
85 -
 86
86 -
 87
87 -
 88
88 -
 89
89 -
 90
90 -
 91
91 -
 92
92 -
 93
93 -
 94
94 -
 95
95 -
 96
96 -
 97
97 -
 98
98 -
 99
99 -
 100
100 -
 101
101 -
 102
102 -
 103
103 -
 104
104 -
 105
105 -
106
-
107
-
108
-
109
-
110
-
111
-
112
 |
 |

Notes to Consolidated Financial Statements
93international business machines corporation and Subsidiary Companies
Stock options to purchase 111,713,072 common shares in
2002, 67,596,737 common shares in 2001 and 34,633,343
common shares in 2000 were outstanding, but were not
included in the computation of diluted earnings per share
because the exercise price of the options was greater than the
average market price of the common shares and, therefore,
the effect would have been antidilutive. Net income applica-
ble to common stockholders excludes preferred stock
dividends of $10 million in 2001 and $20 million in 2000.
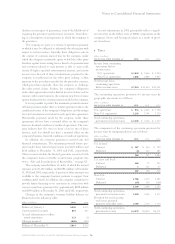
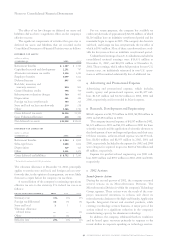
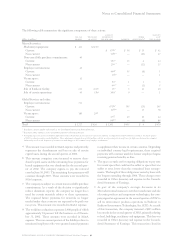
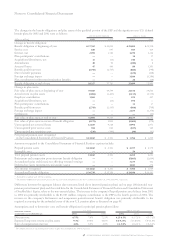
uRental Expense and Lease Commitments
Rental expense from continuing operations, including
amounts charged to inventories and fixed assets, and excluding
amounts previously reserved, was $1,377 million in 2002,
$1,324 million in 2001 and $1,335 million in 2000. The table
below depicts gross minimum rental commitments from con-
tinuing operations under noncancelable leases, amounts
related to vacant space associated with infrastructure reduc-
tion and restructuring actions taken through 1993, and in
1999 and 2002 (previously reserved), and sublease income
commitments. These amounts reflect activities primarily
related to office space as well as manufacturing equipment.
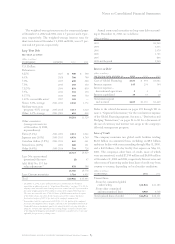
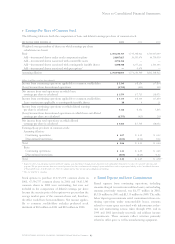
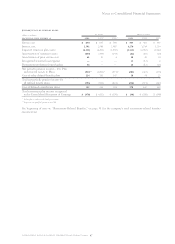
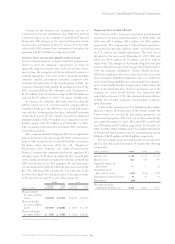
tEarnings Per Share of Common Stock
The following table sets forth the computation of basic and diluted earnings per share of common stock.
for the year ended december 31: 2002 2001 2000
Weighted-average number of shares on which earnings per share
calculations are based:
Basic 1,703,244,345 1,733,348,422 1,763,037,049
Add
—
incremental shares under stock compensation plans 24,807,025 36,595,476 46,750,030
Add
—
incremental shares associated with convertible notes 1,191,136 ——
Add
—
incremental shares associated with contingently issuable shares 1,698,548 1,277,222 2,331,343
Add
—
incremental shares associated with put options*—9,479 —
Assuming dilution 1,730,941,054 1,771,230,599 1,812,118,422
(dollars in millions except per share amounts)
Income from continuing operations applicable to common stockholders $«5,334 $«8,136 $«7,854
(Loss)/income from discontinued operations «««(1,755) ««««(423) ««««219
Net income from total operations on which basic
earnings per share is calculated $«3,579 $«7,713 $«8,073
Income from continuing operations applicable to common stockholders $«5,334 $«8,136 $«7,854
Less
—
net income applicable to contingently issuable shares «18 «4 «21
Income from continuing operations on which diluted earnings
per share is calculated «5,316 «8,132 «7,833
(Loss)/income from discontinued operations on which basic and diluted
earnings per share are calculated «««(1,755) ««««(423) ««««219
Net income from total operations on which diluted
earnings per share is calculated $«3,561 $«7,709 $«8,052
Earnings/(loss) per share of common stock:
Assuming dilution:
Continuing operations $«««3.07 $«««4.59 $«««4.32
Discontinued operations ««««(1.01) «««««(0.24) «««««0.12
Total $«««2.06 $«««4.35 $«««4.44
Basic:
Continuing operations $«««3.13 $«««4.69 $«««4.45
Discontinued operations ««««(1.03) «««««(0.24) ««««0«.12
Total $«««2.10 $«««4.45 $«««4.58**
*Represents short-term put option contracts sold by the company on a limited basis through private placements with independent third parties to reduce the cost of the share buy-back
program. The put option contracts that were executed permitted net share settlement at the company’s option and did not result in a put option liability in the Consolidated Statement
of Financial Position. As of December 31, 2002, the company did not have any put option obligations outstanding.
** Does not total due to rounding.