IBM 2002 Annual Report Download - page 100
Download and view the complete annual report
Please find page 100 of the 2002 IBM annual report below. You can navigate through the pages in the report by either clicking on the pages listed below, or by using the keyword search tool below to find specific information within the annual report.-
 1
1 -
2
-
3
-
4
-
5
-
6
-
7
-
8
-
9
-
10
-
11
-
12
-
13
-
14
-
15
-
16
-
17
-
18
-
19
-
20
-
21
-
22
-
23
-
24
-
25
-
26
-
27
-
28
-
29
-
30
-
31
-
32
-
33
-
34
-
35
-
36
-
37
-
38
-
39
-
40
-
41
-
42
-
43
-
44
-
45
-
46
-
47
-
48
-
49
-
50
-
51
-
52
-
53
-
54
-
55
-
56
-
57
-
58
-
59
-
60
-
61
-
62
-
63
-
64
-
65
-
66
-
67
-
68
-
69
-
70
-
71
-
72
-
73
-
74
-
75
-
76
-
77
-
78
-
79
-
80
-
81
-
82
-
83
-
84
-
85
-
86
-
87
-
88
-
89
-
 90
90 -
 91
91 -
 92
92 -
 93
93 -
 94
94 -
 95
95 -
 96
96 -
 97
97 -
 98
98 -
 99
99 -
 100
100 -
 101
101 -
 102
102 -
 103
103 -
 104
104 -
 105
105 -
 106
106 -
 107
107 -
 108
108 -
 109
109 -
 110
110 -
111
-
112
 |
 |

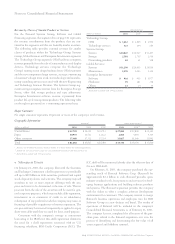
Notes to Consolidated Financial Statements
98 international business machines corporation and Subsidiary Companies
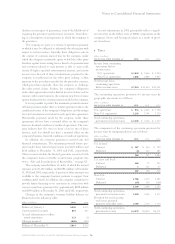
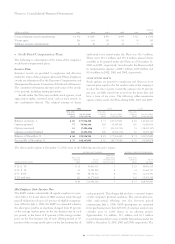
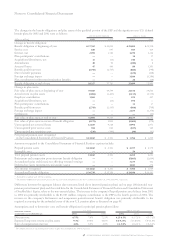
The changes in the benefit obligations and plan assets of the qualified portion of the PPP and the significant non-U.S. defined
benefit plans for 2002 and 2001 were as follows: ppp-qualified portion non-u.s. plans
(dollars in millions) 2002 2001*2002 2001*
Change in benefit obligation:
Benefit obligation at beginning of year $«37,762 $«36,620 $«21,801 $«21,150
Service cost 650 647 505 429
Interest cost 2,591 2,560 1,270 1,214
Plan participants’ contributions ——34 27
Acquisitions/divestitures, net 32 (29) 246 22
Amendments 18 99 (280) 8
Actuarial losses 47 460 80 1,101
Benefits paid from trust (2,743) (2,595) (866) (748)
Direct benefit payments ——(221) (198)
Foreign exchange impact ——3,104 (1,184)
Plan curtailments/settlements/termination benefits ——26 (20)
Benefit obligation at end of year 38,357 37,762 25,699 21,801
Change in plan assets:
Fair value of plan assets at beginning of year 39,565 44,594 21,531 24,833
Actual return on plan assets (3,801) (2,405) (3,135) (1,559)
Employer contribution 3,963 —225 417
Acquisitions/divestitures, net —(29) 191 —
Plan participants’ contributions ——34 27
Benefits paid from trust (2,743) (2,595) (866) (748)
Foreign exchange impact ——2,657 (1,376)
Settlements ———(63)
Fair value of plan assets at end of year** 36,984 39,565 20,637 21,531
Fair value of plan assets in excess of benefit obligation (1,373) 1,803 (5,062) (270)
Unrecognized net actuarial losses 12,187 4,218 8,991 2,871
Unrecognized prior service costs 584 641 (187) 140
Unrecognized net transition asset (216) (360) (36) (42)
Net prepaid pension asset recognized
in the Consolidated Statement of Financial Position $«11,182 $«««6,302 $«««3,706 $«««2,699
Amounts recognized in the Consolidated Statement of Financial Position captions include:
Prepaid pension assets $«11,182 $«««6,302 $«««4,397 $«««4,576
Intangible asset ——54 56
Total prepaid pension assets 11,182 6,302 4,451 4,632
Retirement and nonpension postretirement benefit obligation ——(5,865) (2,669)
Accumulated gains and (losses) not affecting retained earnings ——3,277 462
Deferred tax assets (investments and sundry assets) ——1,843 274
Net amount recognized $«11,182 $«««6,302 $«««3,706 $«««2,699
Accumulated benefit obligation $«36,738 $«35,134 $«24,186 $«20,202
*Reclassified to conform with 2002 presentation.
** The amount of IBM stock represented 5 percent and 1 percent of the total plan assets for the U.S. Plan at December 31, 2002 and 2001, respectively.
Differences between the aggregate balance sheet amounts listed above (material pension plans) and on page 100 (material non-
pension postretirement plan) and the totals listed in the Consolidated Statement of Financial Position and Consolidated Statement
of Stockholders’ Equity, relate to the non-material plans. The increase in the company’s Prepaid pension asset balance from 2001
to 2002 was primarily attributable to the $3,963 million company contribution to the PPP in the fourth quarter of 2002. The
increase in the company’s Retirement and nonpension postretirement benefit obligation was primarily attributable to the
required accounting for the unfunded status of the non-U.S. pension plans as discussed on page 99.
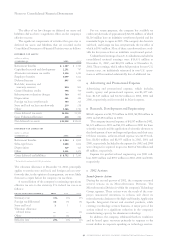
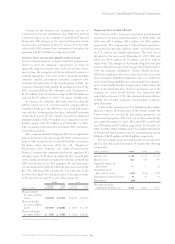
Assumptions used to determine costs and benefit obligations for principal pension plans follow:
weighted-average u.s. plan non-u.s. plans
assumptions as of december 31: 2002 2001 2000 2002 2001 2000
Discount rate 6.75% 7.0% 7.25% 4.25-6.5% 4.5-7.1% 4.5-7.1%
Expected long-term return on plan assets 9.5% *10.0% 10.0% 5.0-9.25% 5.0-10.0% 5.0-11.0%
Rate of compensation increase 4.0% 6.0% 6.0% 2.2-5.0% 2.0-6.1% 2.6-6.1%
*The company lowered its expected long-term return on plan assets assumption for 2003 to 8 percent.