IBM 2002 Annual Report Download - page 58
Download and view the complete annual report
Please find page 58 of the 2002 IBM annual report below. You can navigate through the pages in the report by either clicking on the pages listed below, or by using the keyword search tool below to find specific information within the annual report.-
 1
1 -
2
-
3
-
4
-
5
-
6
-
7
-
8
-
9
-
10
-
11
-
12
-
13
-
14
-
15
-
16
-
17
-
18
-
19
-
20
-
21
-
22
-
23
-
24
-
25
-
26
-
27
-
28
-
29
-
30
-
31
-
32
-
33
-
34
-
35
-
36
-
37
-
38
-
39
-
40
-
41
-
42
-
43
-
44
-
45
-
46
-
47
-
 48
48 -
 49
49 -
 50
50 -
 51
51 -
 52
52 -
 53
53 -
 54
54 -
 55
55 -
 56
56 -
 57
57 -
 58
58 -
 59
59 -
 60
60 -
 61
61 -
 62
62 -
 63
63 -
 64
64 -
 65
65 -
 66
66 -
 67
67 -
 68
68 -
69
-
70
-
71
-
72
-
73
-
74
-
75
-
76
-
77
-
78
-
79
-
80
-
81
-
82
-
83
-
84
-
85
-
86
-
87
-
88
-
89
-
90
-
91
-
92
-
93
-
94
-
95
-
96
-
97
-
98
-
99
-
100
-
101
-
102
-
103
-
104
-
105
-
106
-
107
-
108
-
109
-
110
-
111
-
112
 |
 |

Management Discussion
56 international business machines corporation and Subsidiary Companies
(dollars in millions)
for the year ended december 31: 2002 2001 2000
Net cash provided by/
(used in) continuing
operations:
Operating activities $«13,788 $«13,966 $««8,837
Investing activities (6,897) (5,862) «(4,001)
Financing activities (7,265) (5,309) (6,359)
Effect of exchange rate
changes on cash and
cash equivalents 148 (83) (147)
Net cash (used in)/provided
by discontinued operations*(722) 55 190
Net change in cash and
cash equivalents $÷«««(948) $«««2,767 $«(1,480)
*Does not include approximately $1,170 million of net proceeds from the sale of the
HDD business. Such proceeds are included in Net cash used in from Investing
activities in the table above.
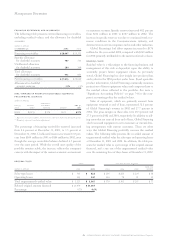
Working Capital
(dollars in millions)
at december 31: 2002 2001
Current assets $«41,652 $«42,461
Current liabilities 34,550 35,119
Working capital $÷«7,102 $«««7,342
Current ratio 1.21:1 1.21:1
In 2002 the company continued to focus on cash generation
and improved its performance in several key working capital
components, particularly accounts receivable and inventory.
The $809 million decrease in Current assets was due prima-
rily to the decline of $1,156 million in Inventories due to
improvements in inventory levels across all business units and
divestitures. The company’s inventory levels now stand at a
20-year low and inventory turnover increased year to year. In
addition, there was a decrease of $418 million in Cash and
cash equivalents and Marketable securities, resulting from the
$2,852 million cash payment for the purchase of PwCC, the
$2,092 million cash contribution to fund the PPP, and $857
million in restructuring payments. These cash outlays were
partially offset by the $1,170 million of net cash received
from the sale of the HDD business to Hitachi, approximately
$650 million received from the monetization of interest rate
swaps associated with the company’s debt portfolio, and the
collection of a receivable for prior years’ taxes and interest of
$460 million. The decline of $660 million in Short-term
financing receivables (see pages 60 through 63 and page 81)
was offset by the $814 million increase in Notes and accounts
receivable
—
trade, which resulted from the acquisition of
PwCC and the stronger fourth quarter revenue in 2002 as
compared to 2001.
Current liabilities decreased $569 million primarily due to
the $5,157 million decline in Short-term debt (primarily
associated with the company’s Global Financing business, see
pages 60 through 63), partially offset by increases in Accounts
payable of $583 million, which was driven by the acquisition
of PwCC and previous intercompany payables that were
converted to external accounts payable as a result of the HDD
divestiture on December 31, 2002, as well as increases in Other
accrued liabilities of $2,192 million primarily due to the 2002
actions taken by the company as described in note s, “2002
Actions,” on pages 90 through 92 and due to increases in
short-term derivatives that are in a liability position, as well
as increases in Deferred income of $1,053 million primarily
due to the impact of foreign currencies.
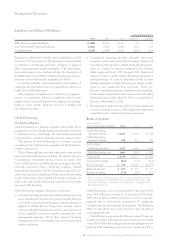
Investments
The company made strategic acquisitions in 2002, totaling
$3,958 million, including the purchase of PwCC for $3,474
million ($2,852 million in cash, $294 million primarily in the
form of restricted shares of IBM common stock and $328 mil-
lion in notes convertible to restricted shares of IBM common
stock). In addition, $4,750 million was invested in RD&E and
the company capitalized external software costs of $254 mil-
lion and $343 million of internal-use software costs.
The company invested $4,753 million for Plant, rental
machines and other property. This comprises continuing
investments in the Microelectronics Division 300 millimeter
chip-making facility in East Fishkill, New York. In addition,
Global Services purchased equipment for its SO business
and Global Financing invested in equipment for leasing
to customers.
In 2002, the company spent $4,212 million for the repur-
chase of the company’s common shares. At December 31,
2002, the company has remaining authorization to purchase
$3,864 million of IBM common shares in the open market
from time to time, based on market conditions.
The company funded all of these investments primarily
from cash from operations.
Debt and Equity
The company’s funding requirements are continually moni-
tored and strategies are executed to manage the company’s
overall asset and liability profile. Additionally, the company
maintains sufficient flexibility to access global funding sources
as needed. During 2002, the company issued debt denomi-
nated in U.S. dollars and Japanese yen to meet existing
financing needs.
The major rating agencies’ ratings of the company’s debt
securities at December 31, 2002, appear in the table below
and remain unchanged from December 31, 2001:
standard moody’s
and investors fitch
poor’sservice ratings
Senior long-term debt A+ A1 AA-
Commercial paper A-1 Prime-1 F-1+