IBM 2002 Annual Report Download - page 102
Download and view the complete annual report
Please find page 102 of the 2002 IBM annual report below. You can navigate through the pages in the report by either clicking on the pages listed below, or by using the keyword search tool below to find specific information within the annual report.-
 1
1 -
2
-
3
-
4
-
5
-
6
-
7
-
8
-
9
-
10
-
11
-
12
-
13
-
14
-
15
-
16
-
17
-
18
-
19
-
20
-
21
-
22
-
23
-
24
-
25
-
26
-
27
-
28
-
29
-
30
-
31
-
32
-
33
-
34
-
35
-
36
-
37
-
38
-
39
-
40
-
41
-
42
-
43
-
44
-
45
-
46
-
47
-
48
-
49
-
50
-
51
-
52
-
53
-
54
-
55
-
56
-
57
-
58
-
59
-
60
-
61
-
62
-
63
-
64
-
65
-
66
-
67
-
68
-
69
-
70
-
71
-
72
-
73
-
74
-
75
-
76
-
77
-
78
-
79
-
80
-
81
-
82
-
83
-
84
-
85
-
86
-
87
-
88
-
89
-
90
-
91
-
 92
92 -
 93
93 -
 94
94 -
 95
95 -
 96
96 -
 97
97 -
 98
98 -
 99
99 -
 100
100 -
 101
101 -
 102
102 -
 103
103 -
 104
104 -
 105
105 -
 106
106 -
 107
107 -
 108
108 -
 109
109 -
 110
110 -
 111
111 -
 112
112
 |
 |

Notes to Consolidated Financial Statements
100 international business machines corporation and Subsidiary Companies
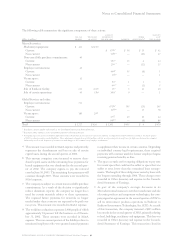
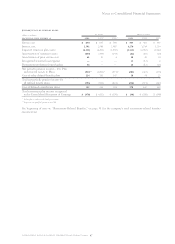
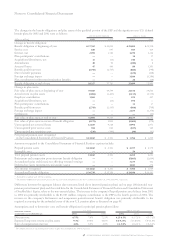
The changes in the benefit obligation and plan assets of
the U.S. plan for 2002 and 2001 are as follows:
(dollars in millions) 2002 2001
Change in benefit obligation:
Benefit obligation at beginning of year $««6,148 $««6,443
Service cost 49 65
Interest cost 421 437
Actuarial gains (170) (183)
Participant contributions —71
Benefits paid from trust —(68)
Direct benefit payments (566) (617)
Benefit obligation at end of year 5,882 6,148
Change in plan assets:
Fair value of plan assets at
beginning of year 84
Actual return on plan assets 21
Participant contributions 119 71
Benefits paid (119) (68)
Fair value of plan assets at end of year 10 8
Benefit obligation in excess
of plan assets (5,872) (6,140)
Unrecognized net actuarial losses 595 781
Unrecognized prior service costs (493) (653)
Accrued postretirement benefit
liability recognized in the
Consolidated Statement
of Financial Position $«(5,770) $«(6,012)
The plan assets primarily comprise short-term fixed-income
investments.
The benefit obligation was determined by applying the
terms of medical, dental and life insurance plans, including the
effects of established maximums on covered costs, together with
relevant actuarial assumptions. These actuarial assumptions
include a projected health care cost trend rate of 10 percent.
The projected health care cost trend rate assumption is pro-
jected to be 10 percent in 2003, and is assumed to decrease
gradually to 4.5 percent by 2008 and remain constant thereafter.
weighted-average
assumptions for nonpension
postretirement benefit plans
as of december 31: 2002 2001 2000
Discount rate 7.00% 7.00% 7.25%
Expected return on
plan assets 5.0% 5.0% 5.0%
The company evaluates its actuarial assumptions on an annual
basis and considers changes in these long-term factors based
upon market conditions and the requirements of SFAS No. 106,
“Employers’ Accounting for Postretirement Benefits Other
Than Pensions.” The discount rate changes did not have a
material effect on net postretirement benefit cost for the
years ended December 31, 2002, 2001 and 2000.
The health care cost trend rate has an insignificant effect
on plan costs and obligations. A one-percentage-point change
in the assumed health care cost trend rate would have the
following effects as of December 31, 2002:
one-percentage- one-percentage-
(dollars in millions) point increase point decrease
Effect on total service and
interest cost $«««5 $«««(4)
Effect on postretirement
benefit obligation $«32 $«(38)
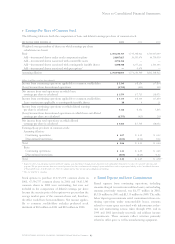
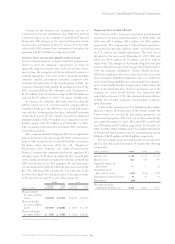
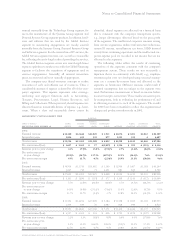
xSegment Information
IBM uses advanced IT to provide customer solutions. The
company operates primarily in a single industry using several
segments that create value by offering a variety of solutions
that include, either singularly or in some combination, tech-
nologies, systems, products, services, software and financing.
Organizationally, the company’s major operations comprise
a Global Services segment; three hardware product segments
—
Systems Group, Personal Systems Group and Technology
Group; a Software segment; a Global Financing segment; and
an Enterprise Investments segment. The segments are deter-
mined based on several factors, including customer base,
homogeneity of products, technology and delivery channels.
Information about each segment’s business and the products
and services that generate each segment’s revenue is located
in the “Description of Business” sections of the Management
Discussion on pages 44 through 50 and page 60.
In the first quarter of 2001, the company reorganized the
Personal Systems segment and renamed it the Personal and
Printing Systems segment. In accordance with the organiza-
tional change, the company transferred the Printing Systems
Division from the Technology segment to the Personal and
Printing Systems segment. At the same time, the xSeries
servers were transferred to the Enterprise Systems segment
from the Personal Systems segment.
In 2003, the company renamed all of its hardware seg-
ments without changing the organization of these segments.
The Enterprise Systems segment was renamed the Systems
Group segment, the Personal and Printing Systems segment
was renamed the Personal Systems Group segment and the
Technology segment was renamed the Technology Group
segment.
Due to the sale of the HDD business as described in note c,
“Acquisitions/Divestitures,” on pages 78 to 80 and consis-
tent with the “Basis of Presentation” discussed in note a,
“Significant Accounting Policies,” on page 70, the income
statement and cash flow statement information for the
Technology Group segment has been reclassified to exclude
or to separate the results of the discontinued HDD business.
Segment revenue and pre-tax income include transactions
between the segments that are intended to reflect an arm’s-
length transfer price. Specifically, semiconductors are