IBM 2002 Annual Report Download - page 63
Download and view the complete annual report
Please find page 63 of the 2002 IBM annual report below. You can navigate through the pages in the report by either clicking on the pages listed below, or by using the keyword search tool below to find specific information within the annual report.-
 1
1 -
2
-
3
-
4
-
5
-
6
-
7
-
8
-
9
-
10
-
11
-
12
-
13
-
14
-
15
-
16
-
17
-
18
-
19
-
20
-
21
-
22
-
23
-
24
-
25
-
26
-
27
-
28
-
29
-
30
-
31
-
32
-
33
-
34
-
35
-
36
-
37
-
38
-
39
-
40
-
41
-
42
-
43
-
44
-
45
-
46
-
47
-
48
-
49
-
50
-
51
-
52
-
 53
53 -
 54
54 -
 55
55 -
 56
56 -
 57
57 -
 58
58 -
 59
59 -
 60
60 -
 61
61 -
 62
62 -
 63
63 -
 64
64 -
 65
65 -
 66
66 -
 67
67 -
 68
68 -
 69
69 -
 70
70 -
 71
71 -
 72
72 -
 73
73 -
74
-
75
-
76
-
77
-
78
-
79
-
80
-
81
-
82
-
83
-
84
-
85
-
86
-
87
-
88
-
89
-
90
-
91
-
92
-
93
-
94
-
95
-
96
-
97
-
98
-
99
-
100
-
101
-
102
-
103
-
104
-
105
-
106
-
107
-
108
-
109
-
110
-
111
-
112
 |
 |

Management Discussion
61international business machines corporation and Subsidiary Companies
compared to 2000. The increases in 2002 gross profit dollars
and gross profit margin were primarily driven by lower bor-
rowing costs related to the current interest rate environment.
The increase in 2001 was driven by lower borrowing costs
discussed above and improved margins in used equipment
sales due to a mix change to higher margin products.
Global Financing pre-tax income decreased 16.4 percent
in 2002 versus 2001, following a decrease of 2.8 percent in 2001
versus 2000. The decrease in 2002 was driven by an increase in
the provision for bad debts due to the current economic envi-
ronment. See page 62 for an additional discussion of Global
Financing Allowance for Doubtful Accounts. The decrease in
2001 was due to increases in provision for bad debts partially
offset by an increase in gross profit discussed above.
The decline in return on equity from 2001 to 2002 was
due to lower earnings primarily associated with an increased
provision for bad debts expense. The increase in return on
equity from 2000 to 2001 was primarily due to the decline in
the equity balance from 2000 to 2001 as evidenced by the
increase in the debt to equity ratio from 6.6x to 6.8x. See page
62 for a discussion of the allowance for doubtful accounts and
page 63 for a discussion on debt.
Financial Condition
balance sheet
(dollars in millions)
at december 31: 2002 2001
Cash $«««1,157 $««««««785
Net investment in sales-type leases 12,314 12,903
Equipment under operating leases:
External customers 1,922 2,213
Internal customers*1,701 1,585
Customer loans 9,621 9,486
Total customer financing assets 25,558 26,187
Commercial financing receivables 5,525 6,500
Intercompany financing receivables*1,616 1,883
Other receivables 445 597
Other assets 941 718
Total financing assets $«35,242 $«36,670
Intercompany payables*$«««5,383 $«««4,820
Debt 23,828 25,545
Other liabilities 2,556 2,548
Total financing liabilities 31,767 32,913
Total financing equity 3,475 ««3,757
Total financing liabilities and equity $«35,242 $«36,670
*Amounts eliminated for purposes of IBM’s consolidated results and therefore do not
appear on pages 65 or on page 69. These assets, along with the other assets in this
table, are however, leveraged using Global Financing debt.
sources and uses of funds
The primary use of funds in Global Financing is to originate
customer and commercial financing assets. Customer financ-
ing assets for end users consist primarily of IBM hardware,
software and services, but also include non-IBM equipment,
software and services to meet IBM customers’ total solutions
requirements. Customer financing assets are primarily sales-
type, direct financing, and operating leases for equipment as
well as loans for software and services with terms generally
for two to five years.
Commercial financing originations arise primarily from
inventory and accounts receivable financing for dealers and
remarketers of IBM and non-IBM products. Payment terms
for inventory financing generally range from 30 to 75 days.
Payment terms for accounts receivable financing generally
range from 30 to 90 days. Also included in commercial financ-
ing assets are syndicated loans.
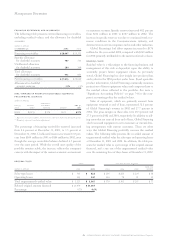
originations
The following are total external and internal financing
originations.
(dollars in millions)
for the year ended december 31: 2002 2001
Customer finance:
External $«12,845 $«15,620
Internal 1,061 931
Commercial finance 22,546 25,071
Total $«36,452 $«41,622
The decreases in originations were due to a lower demand
for IT equipment associated with the current economic
environment.
Cash collections of both customer and commercial financ-
ing assets exceeded new financing originations in both 2002
and 2001, which resulted in a net decline in financing assets
in these years. Cash collections in 2002 and 2001 included
$218 million and zero, respectively, generated through sales
of portions of Global Financing’s syndicated loan portfolio.
These sales transactions did not have a material impact on the
company’s Consolidated Statement of Earnings. Additionally,
funds were generated through the sale and lease of used equip-
ment sourced primarily from prior years’ lease originations.
Cash generated by Global Financing was deployed to pay
dividends to IBM and to reduce debt.
financing assets by sector
The following are the percentage of external financing assets
by industry sector.
at december 31: 2002 2001
Financial Services 31% 27%
Industrial 18 21
Business Partners*14 13
Communications 12 13
Distribution 11 9
Public 10 12
Other 45
Total 100% 100%
*Business Partner financing assets represent a portion of commercial financing inventory
and accounts receivable financing for terms generally less than 90 days.