IBM 2002 Annual Report Download - page 83
Download and view the complete annual report
Please find page 83 of the 2002 IBM annual report below. You can navigate through the pages in the report by either clicking on the pages listed below, or by using the keyword search tool below to find specific information within the annual report.-
 1
1 -
2
-
3
-
4
-
5
-
6
-
7
-
8
-
9
-
10
-
11
-
12
-
13
-
14
-
15
-
16
-
17
-
18
-
19
-
20
-
21
-
22
-
23
-
24
-
25
-
26
-
27
-
28
-
29
-
30
-
31
-
32
-
33
-
34
-
35
-
36
-
37
-
38
-
39
-
40
-
41
-
42
-
43
-
44
-
45
-
46
-
47
-
48
-
49
-
50
-
51
-
52
-
53
-
54
-
55
-
56
-
57
-
58
-
59
-
60
-
61
-
62
-
63
-
64
-
65
-
66
-
67
-
68
-
69
-
70
-
71
-
72
-
 73
73 -
 74
74 -
 75
75 -
 76
76 -
 77
77 -
 78
78 -
 79
79 -
 80
80 -
 81
81 -
 82
82 -
 83
83 -
 84
84 -
 85
85 -
 86
86 -
 87
87 -
 88
88 -
 89
89 -
 90
90 -
 91
91 -
 92
92 -
 93
93 -
94
-
95
-
96
-
97
-
98
-
99
-
100
-
101
-
102
-
103
-
104
-
105
-
106
-
107
-
108
-
109
-
110
-
111
-
112
 |
 |
Notes to Consolidated Financial Statements
81international business machines corporation and Subsidiary Companies
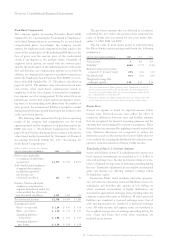
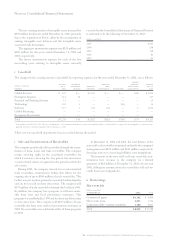
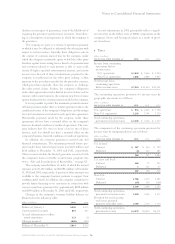
eInventories
(dollars in millions)
at december 31: 2002 2001
Finished goods $««««««960 $«««1,259
Work in process and raw materials 2,188 3,045
Total $«««3,148 $«««4,304
fFinancing Receivables
(dollars in millions)
at december 31: 2002 2001*
Short-term:
Net investment in sales-type leases $«««5,779 $«««6,029
Commercial financing receivables «««4,972 «««5,416
Customer loans receivable 4,462 4,225
Installment payment receivables 698 844
Other non-Global Financing related 85 142
Total $«15,996 $«16,656
Long-term:
Net investment in sales-type leases $«««6,505 $«««6,822
Customer loans receivable 4,179 4,014
Commercial financing receivables 462 1,009
Installment payment receivables 273 396
Other non-Global Financing related 21 5
Total $«11,440 $«12,246
*Reclassified to conform with 2002 presentation.
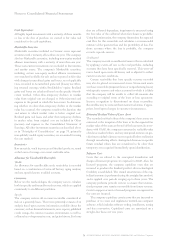
Net investment in sales-type leases is for leases that relate
principally to IBM equipment and are generally for terms
ranging from two to five years. Net investment in sales-type
leases includes unguaranteed residual values of $821 million
and $791 million at December 31, 2002 and 2001, respectively,
and is reflected net of unearned income at those dates of
$1,330 million and $1,428 million, respectively. Scheduled
maturities of minimum lease payments outstanding at
December 31, 2002, expressed as a percentage of the total,
are approximately as follows: 2003, 51 percent; 2004, 28 per-
cent; 2005, 15 percent; 2006, 4 percent; and 2007 and beyond,
2 percent.
Customer loans receivable are provided by Global
Financing to the company’s customers to finance the purchase
of the company’s software and services. Global Financing is
one of many sources of funding from which customers can
choose. Separate contractual relationships on these financing
arrangements are generally for terms ranging from one to
three years requiring straight-line payments over the term.
Each financing contract is priced independently at competi-
tive market rates. The company has a history of enforcing the
terms of these separate financing agreements.
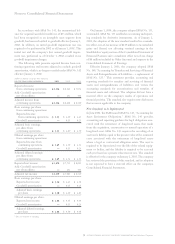
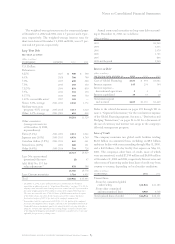
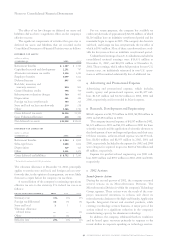
gPlant, Rental Machines and Other Property
(dollars in millions)
at december 31: 2002 2001
Land and land improvements $««««««837 $««««««859
Buildings and building improvements 8,978 10,073
Plant, laboratory and office equipment 21,416 22,369
31,231 33,301
Less: Accumulated depreciation 18,525 18,982
12,706 14,319
Rental machines 4,852 5,074
Less: Accumulated depreciation 3,118 2,889
1,734 2,185
Total $«14,440 $«16,504
hInvestments and Sundry Assets
(dollars in millions)
at december 31: 2002 2001*
Deferred taxes $«4,314 $«2,395
Alliance investments:
Equity method 562 544
Other 249 574
Software 834 833
Derivatives
—
non-current** 689 230
Intangible assets, net
(other than goodwill) 562 356
Receivable from Hitachi+356 —
Marketable securities
—
non-current 192 124
Other assets 1,076 1,361
Total $«8,834 $«6,417
*Reclassified to conform with 2002 presentation.
** See note L, “Derivatives and Hedging Transactions” on pages 84 to 86 for the fair
value of all derivatives reported in the Consolidated Statement of Financial Position.
+See note C, “Acquisitions/Divestitures” on pages 78 to 80 for additional information.
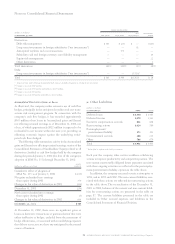
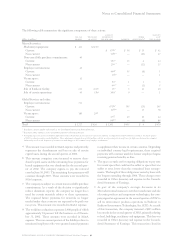
The following schedule details the company’s intangible asset
balances by major asset class:
gross net carrying
(dollars in millions) carrying accumulated amount at
intangible asset class amount amortization dec. 31, 2002
Customer-related $««««517 $«(124) $«393
Completed technology 229 (108) 121
Strategic alliances 118 (15) 103
Patents/trademarks 109 (80) 29
Other*«98 «««(7) «91
Total $«1,071 $«(334) $«737**
*Other intangibles are primarily acquired proprietary and nonproprietary business
processes, methodologies and systems.
** The $737 million comprises $175 million recorded as current assets and $562 million
recorded as non-current assets.