Harley Davidson 2012 Annual Report Download - page 99
Download and view the complete annual report
Please find page 99 of the 2012 Harley Davidson annual report below. You can navigate through the pages in the report by either clicking on the pages listed below, or by using the keyword search tool below to find specific information within the annual report.-
 1
1 -
2
-
3
-
4
-
5
-
6
-
7
-
8
-
9
-
10
-
11
-
12
-
13
-
14
-
15
-
16
-
17
-
18
-
19
-
20
-
21
-
22
-
23
-
24
-
25
-
26
-
27
-
28
-
29
-
30
-
31
-
32
-
33
-
34
-
35
-
36
-
37
-
38
-
39
-
40
-
41
-
42
-
43
-
44
-
45
-
46
-
47
-
48
-
49
-
50
-
51
-
52
-
53
-
54
-
55
-
56
-
57
-
58
-
59
-
60
-
61
-
62
-
63
-
64
-
65
-
66
-
67
-
68
-
69
-
70
-
71
-
72
-
73
-
74
-
75
-
76
-
77
-
78
-
79
-
80
-
81
-
82
-
83
-
84
-
85
-
86
-
87
-
88
-
 89
89 -
 90
90 -
 91
91 -
 92
92 -
 93
93 -
 94
94 -
 95
95 -
 96
96 -
 97
97 -
 98
98 -
 99
99 -
 100
100 -
 101
101 -
 102
102 -
 103
103 -
 104
104 -
 105
105 -
 106
106 -
 107
107 -
 108
108 -
 109
109 -
110
-
111
-
112
-
113
-
114
-
115
-
116
-
117
-
118
-
119
-
120
-
121
-
122
-
123
-
124
-
125
-
126
-
127
-
128
-
129
-
130
-
131
-
132
-
133
-
134
-
135
-
136
-
137
-
138
-
139
-
140
-
141
-
142
-
143
 |
 |

99
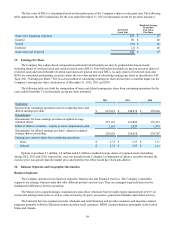
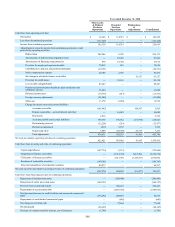
Information by segment is set forth below for the years ended December 31 (in thousands):
2012 2011 2010
Motorcycles net revenue $ 4,942,582 $ 4,662,264 $ 4,176,627
Gross profit 1,720,188 1,555,976 1,427,403
Selling, administrative and engineering expense 976,224 926,808 885,137
Restructuring expense and other impairments 28,475 67,992 163,508
Operating income from Motorcycles $ 715,489 $ 561,176 $ 378,758
Financial services revenue $ 637,924 $ 649,449 $ 682,709
Financial services expense 353,237 380,658 500,836
Operating income from Financial Services $ 284,687 $ 268,791 $ 181,873
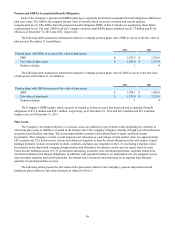
Financial Services revenue includes $11.5 million, $10.5 million and $9.2 million of interest that HDMC paid to HDFS
on wholesale finance receivables in 2012, 2011 and 2010, respectively. This interest was paid on behalf of HDMC’s
independent dealers as a way to enable dealers to manage seasonal increases in inventory. The offsetting cost of these interest
incentives was recorded as a reduction to Motorcycles revenue.
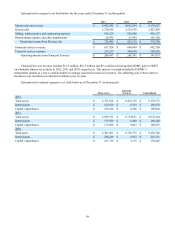
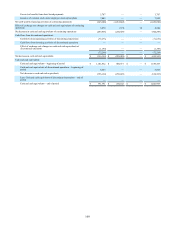
Information by industry segment is set forth below as of December 31 (in thousands):
Motorcycles Financial
Services Consolidated
2012
Total assets $ 2,751,018 $ 6,419,755 $ 9,170,773
Depreciation $ 162,659 $ 6,319 $ 168,978
Capital expenditures $ 180,416 $ 8,586 $ 189,002
2011
Total assets $ 2,959,333 $ 6,714,831 $ 9,674,164
Depreciation $ 173,959 $ 6,449 $ 180,408
Capital expenditures $ 179,988 $ 9,047 $ 189,035
2010
Total assets $ 2,701,965 $ 6,728,775 $ 9,430,740
Depreciation $ 248,246 $ 6,925 $ 255,171
Capital expenditures $ 167,730 $ 3,115 $ 170,845