Harley Davidson 2012 Annual Report Download - page 82
Download and view the complete annual report
Please find page 82 of the 2012 Harley Davidson annual report below. You can navigate through the pages in the report by either clicking on the pages listed below, or by using the keyword search tool below to find specific information within the annual report.-
 1
1 -
2
-
3
-
4
-
5
-
6
-
7
-
8
-
9
-
10
-
11
-
12
-
13
-
14
-
15
-
16
-
17
-
18
-
19
-
20
-
21
-
22
-
23
-
24
-
25
-
26
-
27
-
28
-
29
-
30
-
31
-
32
-
33
-
34
-
35
-
36
-
37
-
38
-
39
-
40
-
41
-
42
-
43
-
44
-
45
-
46
-
47
-
48
-
49
-
50
-
51
-
52
-
53
-
54
-
55
-
56
-
57
-
58
-
59
-
60
-
61
-
62
-
63
-
64
-
65
-
66
-
67
-
68
-
69
-
70
-
71
-
 72
72 -
 73
73 -
 74
74 -
 75
75 -
 76
76 -
 77
77 -
 78
78 -
 79
79 -
 80
80 -
 81
81 -
 82
82 -
 83
83 -
 84
84 -
 85
85 -
 86
86 -
 87
87 -
 88
88 -
 89
89 -
 90
90 -
 91
91 -
 92
92 -
93
-
94
-
95
-
96
-
97
-
98
-
99
-
100
-
101
-
102
-
103
-
104
-
105
-
106
-
107
-
108
-
109
-
110
-
111
-
112
-
113
-
114
-
115
-
116
-
117
-
118
-
119
-
120
-
121
-
122
-
123
-
124
-
125
-
126
-
127
-
128
-
129
-
130
-
131
-
132
-
133
-
134
-
135
-
136
-
137
-
138
-
139
-
140
-
141
-
142
-
143
 |
 |
82
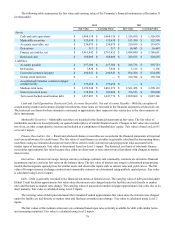
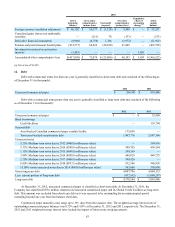
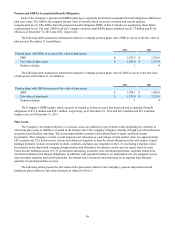
The following tables summarize the amount of gains and losses for the years ended December 31 related to derivative
financial instruments designated as fair value hedges (in thousands):
Amount of (Loss)
Recognized in Income on Derivative
Fair Value Hedges 2012 2011 2010
Interest rate swaps – medium-term notes(a) $ — $ — $ (6,072)
(a) Gain/(loss) recognized in income is included in financial services interest expense.
Amount of Gain
Recognized in Income on Hedged Debt
Fair Value Hedges 2012 2011 2010
Interest rate swaps – medium-term notes(a) $ — $ — $ 6,072
(a) Gain/(loss) recognized in income is included in financial services interest expense.
The following table summarizes the amount of gains and losses for the years ended December 31 related to derivative
financial instruments not designated as hedging instruments (in thousands):
Amount of Gain/(Loss)
Recognized in Income on Derivative
Derivatives not Designated as Hedges 2012 2011 2010
Commodities contracts(a) $(535) $ — $ —
Derivatives – securitization transactions(b) — — (8)
Derivatives – conduit facility(b) — — (6,343)
$(535) $ — $ (6,351)
(a) Gain/(loss) recognized in income is included in cost of goods sold.
(b) Gain/(loss) recognized in income is included in financial services revenue.
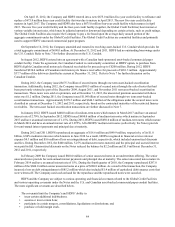
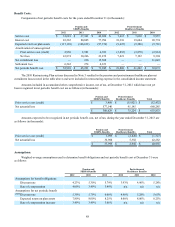
11. Accumulated Other Comprehensive Loss
The following table sets forth the changes in accumulated other comprehensive loss (AOCL) for the years ended
December 31 (in thousands):
2012
AOCL
beginning
balance
Gross other
comprehensive
income (loss) Tax benefit
(expense)
Net other
comprehensive
income (loss) AOCL ending
balance
Foreign currency translation adjustment $ 49,935 $ 2,212 $ (812) $ 1,400 $ 51,335
Unrealized gains (losses) on marketable securities 327 556 (206) 350 677
Derivative financial instruments 6,307 (16,153) 6,009 (10,144)(3,837)
Pension and postretirement benefit plans (533,302)(194,649) 72,098 (122,551)(655,853)
Accumulated other comprehensive loss $ (476,733) $ (208,034) $ 77,089 $ (130,945) $ (607,678)
2011
AOCL
beginning
balance
Gross other
comprehensive
income (loss) Tax benefit
(expense)
Net other
comprehensive
income (loss) AOCL ending
balance
Foreign currency translation adjustment $ 55,551 $ (6,251) $ 635 $ (5,616) $ 49,935
Unrealized gains (losses) on marketable securities (133) 731 (271) 460 327
Derivative financial instruments (11,912) 28,864 (10,645) 18,219 6,307
Pension and postretirement benefit plans (409,728)(196,274) 72,700 (123,574)(533,302)
Accumulated other comprehensive loss $ (366,222) $ (172,930) $ 62,419 $ (110,511) $ (476,733)