Harley Davidson 2012 Annual Report Download - page 30
Download and view the complete annual report
Please find page 30 of the 2012 Harley Davidson annual report below. You can navigate through the pages in the report by either clicking on the pages listed below, or by using the keyword search tool below to find specific information within the annual report.-
 1
1 -
2
-
3
-
4
-
5
-
6
-
7
-
8
-
9
-
10
-
11
-
12
-
13
-
14
-
15
-
16
-
17
-
18
-
19
-
 20
20 -
 21
21 -
 22
22 -
 23
23 -
 24
24 -
 25
25 -
 26
26 -
 27
27 -
 28
28 -
 29
29 -
 30
30 -
 31
31 -
 32
32 -
 33
33 -
 34
34 -
 35
35 -
 36
36 -
 37
37 -
 38
38 -
 39
39 -
 40
40 -
41
-
42
-
43
-
44
-
45
-
46
-
47
-
48
-
49
-
50
-
51
-
52
-
53
-
54
-
55
-
56
-
57
-
58
-
59
-
60
-
61
-
62
-
63
-
64
-
65
-
66
-
67
-
68
-
69
-
70
-
71
-
72
-
73
-
74
-
75
-
76
-
77
-
78
-
79
-
80
-
81
-
82
-
83
-
84
-
85
-
86
-
87
-
88
-
89
-
90
-
91
-
92
-
93
-
94
-
95
-
96
-
97
-
98
-
99
-
100
-
101
-
102
-
103
-
104
-
105
-
106
-
107
-
108
-
109
-
110
-
111
-
112
-
113
-
114
-
115
-
116
-
117
-
118
-
119
-
120
-
121
-
122
-
123
-
124
-
125
-
126
-
127
-
128
-
129
-
130
-
131
-
132
-
133
-
134
-
135
-
136
-
137
-
138
-
139
-
140
-
141
-
142
-
143
 |
 |

30
(c) Europe data includes Austria, Belgium, Denmark, Finland, France, Germany, Greece, Italy, Netherlands, Norway, Portugal, Spain, Sweden,
Switzerland, and the United Kingdom. Industry retail motorcycle registration data includes 651+cc models derived from information provided by
Association des Constructeurs Europeens de Motocycles (ACEM), an independent agency. This third-party data is subject to revision and update.
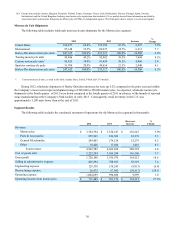
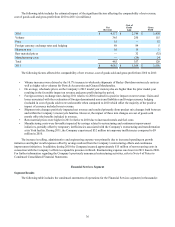
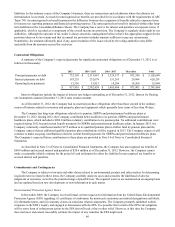
Motorcycle Unit Shipments
The following table includes wholesale motorcycle unit shipments for the Motorcycles segment:
2012 2011 Increase %
Change
United States 160,477 64.8% 152,180 65.3% 8,297 5.5%
International 87,148 35.2% 80,937 34.7% 6,211 7.7
Harley-Davidson motorcycle units 247,625 100.0% 233,117 100.0% 14,508 6.2%
Touring motorcycle units 99,496 40.2% 92,002 39.5% 7,494 8.1%
Custom motorcycle units*96,425 38.9% 91,459 39.2% 4,966 5.4
Sportster motorcycle units 51,704 20.9% 49,656 21.3% 2,048 4.1
Harley-Davidson motorcycle units 247,625 100.0% 233,117 100.0% 14,508 6.2%
* Custom motorcycle units, as used in this table, include Dyna, Softail, V-Rod and CVO models.
During 2012, wholesale shipments of Harley-Davidson motorcycles were up 6.2% compared to the prior year and within
the Company’s most recent expected shipment range of 245,000 to 250,000 motorcycles. As expected, wholesale motorcycle
shipments in the fourth quarter of 2012 were down compared to the fourth quarter of 2011 in advance of the launch of seasonal
surge manufacturing at the Company's York facility in early 2013. Consequently, retail inventory in the U.S. was
approximately 1,200 units lower than at the end of 2011.
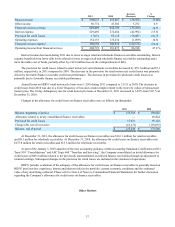
Segment Results
The following table includes the condensed statement of operations for the Motorcycles segment (in thousands):
2012 2011 (Decrease)
Increase %
Change
Revenue:
Motorcycles $ 3,764,794 $ 3,554,547 $ 210,247 5.9%
Parts & Accessories 859,945 816,569 43,376 5.3
General Merchandise 299,403 274,124 25,279 9.2
Other 18,440 17,024 1,416 8.3
Total revenue 4,942,582 4,662,264 280,318 6.0
Cost of goods sold 3,222,394 3,106,288 116,106 3.7
Gross profit 1,720,188 1,555,976 164,212 10.6
Selling & administrative expense 846,894 788,565 58,329 7.4
Engineering expense 129,330 138,243 (8,913)(6.4)
Restructuring expense 28,475 67,992 (39,517)(58.1)
Operating expense 1,004,699 994,800 9,899 1.0
Operating income from motorcycles $ 715,489 $ 561,176 $ 154,313 27.5%