Harley Davidson 2012 Annual Report Download - page 42
Download and view the complete annual report
Please find page 42 of the 2012 Harley Davidson annual report below. You can navigate through the pages in the report by either clicking on the pages listed below, or by using the keyword search tool below to find specific information within the annual report.-
 1
1 -
2
-
3
-
4
-
5
-
6
-
7
-
8
-
9
-
10
-
11
-
12
-
13
-
14
-
15
-
16
-
17
-
18
-
19
-
20
-
21
-
22
-
23
-
24
-
25
-
26
-
27
-
28
-
29
-
30
-
31
-
 32
32 -
 33
33 -
 34
34 -
 35
35 -
 36
36 -
 37
37 -
 38
38 -
 39
39 -
 40
40 -
 41
41 -
 42
42 -
 43
43 -
 44
44 -
 45
45 -
 46
46 -
 47
47 -
 48
48 -
 49
49 -
 50
50 -
 51
51 -
 52
52 -
53
-
54
-
55
-
56
-
57
-
58
-
59
-
60
-
61
-
62
-
63
-
64
-
65
-
66
-
67
-
68
-
69
-
70
-
71
-
72
-
73
-
74
-
75
-
76
-
77
-
78
-
79
-
80
-
81
-
82
-
83
-
84
-
85
-
86
-
87
-
88
-
89
-
90
-
91
-
92
-
93
-
94
-
95
-
96
-
97
-
98
-
99
-
100
-
101
-
102
-
103
-
104
-
105
-
106
-
107
-
108
-
109
-
110
-
111
-
112
-
113
-
114
-
115
-
116
-
117
-
118
-
119
-
120
-
121
-
122
-
123
-
124
-
125
-
126
-
127
-
128
-
129
-
130
-
131
-
132
-
133
-
134
-
135
-
136
-
137
-
138
-
139
-
140
-
141
-
142
-
143
 |
 |
42
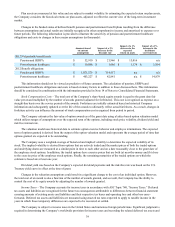
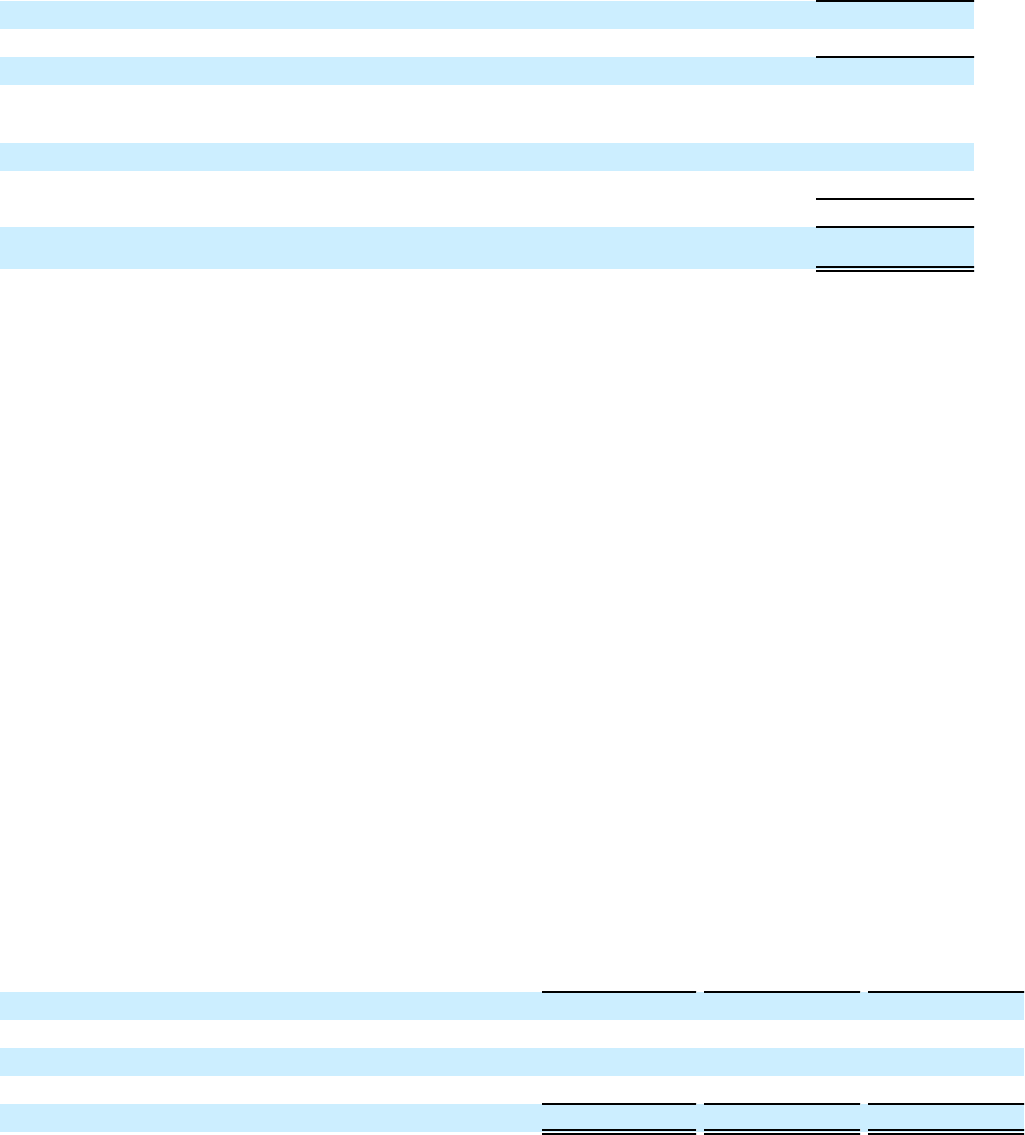
December 31,
2012
Cash and cash equivalents $ 1,068,138
Marketable securities 135,634
Total cash and cash equivalents and marketable securities 1,203,772
Global credit facilities 1,055,057
Asset-backed U.S commercial paper conduit facility (a) 600,000
Asset-backed Canadian commercial paper conduit facility (b) 25,782
Total availability under credit facilities 1,680,839
Total $ 2,884,611
(a) The U.S. commercial paper conduit facility expires on September 13, 2013. The Company anticipates that it will renew this facility prior to expiration(1).
(b) The Canadian commercial paper conduit facility expires on August 30, 2013 and is limited to Canadian denominated borrowings. The Company anticipates
that it will renew this facility prior to expiration(1).
Although the Company believes it has obtained the funding necessary to support HDFS’ operations for 2013(1), the
Company recognizes that it must continue to adjust its business to changes in the lending environment. The Company intends
to continue with a diversified funding profile through a combination of short-term and long-term funding vehicles and to
pursue a variety of sources to obtain cost-effective funding. The Financial Services operations could be negatively affected by
higher costs of funding and the increased difficulty of raising, or potential unsuccessful efforts to raise, funding in the short-
term and long-term capital markets.(1) These negative consequences could in turn adversely affect the Company’s business and
results of operations in various ways, including through higher costs of capital, reduced funds available through its Financial
Services operations to provide loans to independent dealers and their retail customers, and dilution to existing shareholders
through the use of alternative sources of capital.
The Company has long-term obligations related to its qualified pension, SERPA and postretirement healthcare plans at
December 31, 2012. During 2012, the Company contributed $244.4 million to its qualified pension, SERPA and postretirement
healthcare plans, which includes a $200.0 million voluntary contribution to its pension plans. In January 2013, the Company
made a voluntary contribution of $175.0 million to its qualified pension plans to further fund its pension plans and expects that
no qualified pension plan contributions will be required in 2013.(1) The Company expects it will continue to make on-going
contributions related to current benefit payments for SERPA and postretirement healthcare plans. The Company’s expected
future contributions to these plans are provided in Note 14 of Notes to Consolidated Financial Statements.
Cash Flow Activity
The following table summarizes the cash flow activity of continuing operations for the years ended December 31, 2012,
2011 and 2010 (in thousands):
2012 2011 2010
Net cash provided by operating activities (a) $ 801,458 $ 885,291 $ 1,163,418
Net cash (used) provided by investing activities (261,311)(63,542) 145,437
Net cash (used) provided by financing activities (a) (990,073)(308,944)(1,856,090)
Effect of exchange rate changes on cash and cash equivalents (8,886)(7,788) 4,940
Net increase (decrease) in cash and cash equivalents $ (458,812) $ 505,017 $ (542,295)
(a) The 2012 cash flow from operating activities and the 2012 cash flow from financing activities amounts presented above reflect
revisions from the unaudited amounts presented in the Company's earnings press release published on January 29, 2013. The
revisions resulted in an increase in cash flow from operating activities and an offsetting decrease to cash flow from financing
activities of $8.4 million; there was no change to the net decrease in cash and cash equivalents.
Operating Activities