Harley Davidson 2012 Annual Report Download - page 24
Download and view the complete annual report
Please find page 24 of the 2012 Harley Davidson annual report below. You can navigate through the pages in the report by either clicking on the pages listed below, or by using the keyword search tool below to find specific information within the annual report.-
 1
1 -
2
-
3
-
4
-
5
-
6
-
7
-
8
-
9
-
10
-
11
-
12
-
13
-
 14
14 -
 15
15 -
 16
16 -
 17
17 -
 18
18 -
 19
19 -
 20
20 -
 21
21 -
 22
22 -
 23
23 -
 24
24 -
 25
25 -
 26
26 -
 27
27 -
 28
28 -
 29
29 -
 30
30 -
 31
31 -
 32
32 -
 33
33 -
 34
34 -
35
-
36
-
37
-
38
-
39
-
40
-
41
-
42
-
43
-
44
-
45
-
46
-
47
-
48
-
49
-
50
-
51
-
52
-
53
-
54
-
55
-
56
-
57
-
58
-
59
-
60
-
61
-
62
-
63
-
64
-
65
-
66
-
67
-
68
-
69
-
70
-
71
-
72
-
73
-
74
-
75
-
76
-
77
-
78
-
79
-
80
-
81
-
82
-
83
-
84
-
85
-
86
-
87
-
88
-
89
-
90
-
91
-
92
-
93
-
94
-
95
-
96
-
97
-
98
-
99
-
100
-
101
-
102
-
103
-
104
-
105
-
106
-
107
-
108
-
109
-
110
-
111
-
112
-
113
-
114
-
115
-
116
-
117
-
118
-
119
-
120
-
121
-
122
-
123
-
124
-
125
-
126
-
127
-
128
-
129
-
130
-
131
-
132
-
133
-
134
-
135
-
136
-
137
-
138
-
139
-
140
-
141
-
142
-
143
 |
 |

24
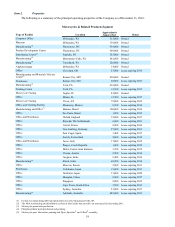
Item 6. Selected Financial Data
(In thousands, except per share amounts) 2012(1) 2011(1) 2010(1) 2009(2) 2008(2)
Statement of operations data:
Revenue:
Motorcycles & Related Products 4,942,582 4,662,264 4,176,627 4,287,130 5,578,414
Financial Services 637,924 649,449 682,709 494,779 376,970
Total revenue 5,580,506 5,311,713 4,859,336 4,781,909 5,955,384
Income from continuing
operations 623,925 548,078 259,669 70,641 684,235
Income (loss) from discontinued
operations, net of tax — 51,036 (113,124)(125,757)(29,517)
Net income (loss) 623,925 599,114 146,545 (55,116) 654,718
Weighted-average common shares:
Basic 227,119 232,889 233,312 232,577 234,225
Diluted 229,229 234,918 234,787 233,573 234,477
Earnings per common share from
continuing operations:
Basic $ 2.75 $ 2.35 $ 1.11 $ 0.30 $ 2.92
Diluted $ 2.72 $ 2.33 $ 1.11 $ 0.30 $ 2.92
Earnings (loss) per common share
from discontinued operations:
Basic $ — $ 0.22 $ (0.48) $ (0.54) $ (0.13)
Diluted $ — $ 0.22 $ (0.48) $ (0.54) $ (0.13)
Earnings (loss) per common share:
Basic $ 2.75 $ 2.57 $ 0.63 $ (0.24) $ 2.80
Diluted $ 2.72 $ 2.55 $ 0.62 $ (0.24) $ 2.79
Dividends paid per common share $ 0.620 $ 0.475 $ 0.400 $ 0.400 $ 1.290
Balance sheet data:
Total assets 9,170,773 9,674,164 9,430,740 9,155,518 7,828,625
Total debt 5,102,649 5,722,619 5,752,356 5,636,129 3,914,887
Total equity 2,557,624 2,420,256 2,206,866 2,108,118 2,115,603
(1) The Company began consolidating formerly off-balance sheet qualifying special purpose entities as required by the new guidance within Accounting
Standards Codification (ASC) Topic 810, “Consolidations” and ASC Topic 860, “Transfers and Servicing” in 2010.
(2) 2009 and 2008 total assets include assets of discontinued operations of $181.2 million and $238.7 million, respectively.