Harley Davidson 2012 Annual Report Download - page 96
Download and view the complete annual report
Please find page 96 of the 2012 Harley Davidson annual report below. You can navigate through the pages in the report by either clicking on the pages listed below, or by using the keyword search tool below to find specific information within the annual report.-
 1
1 -
2
-
3
-
4
-
5
-
6
-
7
-
8
-
9
-
10
-
11
-
12
-
13
-
14
-
15
-
16
-
17
-
18
-
19
-
20
-
21
-
22
-
23
-
24
-
25
-
26
-
27
-
28
-
29
-
30
-
31
-
32
-
33
-
34
-
35
-
36
-
37
-
38
-
39
-
40
-
41
-
42
-
43
-
44
-
45
-
46
-
47
-
48
-
49
-
50
-
51
-
52
-
53
-
54
-
55
-
56
-
57
-
58
-
59
-
60
-
61
-
62
-
63
-
64
-
65
-
66
-
67
-
68
-
69
-
70
-
71
-
72
-
73
-
74
-
75
-
76
-
77
-
78
-
79
-
80
-
81
-
82
-
83
-
84
-
85
-
 86
86 -
 87
87 -
 88
88 -
 89
89 -
 90
90 -
 91
91 -
 92
92 -
 93
93 -
 94
94 -
 95
95 -
 96
96 -
 97
97 -
 98
98 -
 99
99 -
 100
100 -
 101
101 -
 102
102 -
 103
103 -
 104
104 -
 105
105 -
 106
106 -
107
-
108
-
109
-
110
-
111
-
112
-
113
-
114
-
115
-
116
-
117
-
118
-
119
-
120
-
121
-
122
-
123
-
124
-
125
-
126
-
127
-
128
-
129
-
130
-
131
-
132
-
133
-
134
-
135
-
136
-
137
-
138
-
139
-
140
-
141
-
142
-
143
 |
 |

96
Assumptions used in calculating the lattice-based fair value of options granted during 2012, 2011 and 2010 were as
follows:
2012 2011 2010
Expected average term (in years) 6.3 6.5 6.9
Expected volatility 32% - 50% 39% - 52% 42% - 60%
Weighted average volatility 41% 43% 48%
Expected dividend yield 1.1% 1.0% 1.8%
Risk-free interest rate 0.1% - 2.1% 0.1% - 3.7% 0.1% - 3.7%
The following table summarizes the stock option transactions for the year ended December 31, 2012 (in thousands except
for per share amounts):
Options
Weighted-
Average
Price
Options outstanding, beginning of period 6,311 $ 37
Options granted 480 $ 45
Options exercised (1,666) $ 28
Options forfeited (665) $ 52
Options outstanding, end of period 4,460 $ 38
Exercisable, end of period 3,065 $ 42
The weighted-average fair value of options granted during the years ended December 31, 2012, 2011 and 2010 was $14,
$15 and $8, respectively.
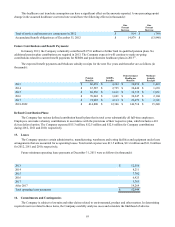
As of December 31, 2012, there was $2.3 million of unrecognized compensation cost related to stock options that is
expected to be recognized over a weighted-average period of 1.5 years.
The following table summarizes the aggregate intrinsic value related to options outstanding, exercisable and exercised as
of and for the years ended December 31 (in thousands):
2012 2011 2010
Exercised $ 34,443 $ 7,919 $ 12,710
Outstanding $ 60,963 $ 55,701 $ 53,249
Exercisable $ 35,873 $ 22,926 $ 8,545
The Company’s policy is to issue new shares of common stock upon the exercise of employee stock options. The
Company has a continuing authorization from its Board of Directors to repurchase shares to offset dilution caused by the
exercise of stock options which is discussed in Note 17.
Stock options outstanding at December 31, 2012 (options in thousands):
Price Range Weighted-Average
Contractual Life Options Weighted-Average
Exercise Price
$10.01 to $20 6.0 910 $ 13
$20.01 to $30 6.9 695 $ 23
$30.01 to $40 4.7 503 $ 39
$40.01 to $50 8.0 910 $ 43
$50.01 to $60 1.6 706 $ 52
$60.01 to $70 2.5 736 $ 65
Options outstanding 5.1 4,460 $ 38
Options exercisable 7.6 3,065 $ 42